New to Assessment?
First time exploring the field of assessment? Fear not. We put together a collection of open-access resources introducing the basics of assessing student learning. We recommend starting here, and then exploring and supplementing these resources with materials that are relevant to your specific practice questions and audiences.
Conversations around assessment, akin to higher education in general, can quickly become jargon filled. Thus a good starting point involves an overview of key terms and acronyms.
Our Acronym List takes the guess work out of what the acronyms for which accrediting agencies and assessment-related organizations stand. It is not an exhaustive list, but does provide a quick, painless reference point.
Our Assessment Glossary contains definitions to terms and concepts you are likely to encounter in assessment literature, practice, conferences, and conversations.
Our Assessment Journal list provides an overview of scholarly journals and sources of information on assessment related literature.
We also have a list of Assessment Related Technologies detailing different software solutions that can meet your assessment needs. As well as additional resources that can be useful as you begin to delve into the assessment landscape including listservs, blogs, and communities of practice.


Activity: What is Your Philosophy of Assessment?
Knowing the philosophical stances of people, disciplines, units or departments on assessment can help improve communication and lower misunderstanding. This activity is designed to enable assessment professionals, and faculty and staff within departments and units, to know which philosophies they are aligned with to help them approach different conversations and communicate about assessment to different groups based on different perspectives.
Without clarity on the philosophy behind assessment, faculty and staff can talk past each other, misunderstand one another, and/or reinforce or obfuscate assessment culture. This activity can serve as a useful tool to explore perceptions and philosophical approaches regarding the purpose and value of assessment.

Activity: What is Your Student Affairs Philosophy of Assessment?
The activity presents a structured exercise to explore what student affairs practitioners believe to be true about the role and purpose of assessment as well as the best means to document student learning in relation to four philosophies: co-curricular learning, measurement of participation/satisfaction, compliance/reporting, and student-centeredness. Done individually or as a group, this activity can support internal communication and strategic planning on assessment

While most institutions will have information on writing learning outcome statements on an assessment website or center for teaching and learning website, we have compiled a sampling of a few different resources on various perspectives and approaches to writing learning outcome statements.
- A Brief Introduction to Creating Learning Outcomes by NILOA coach, Joe Levy
- Verbs that are useful for writing learning outcomes
- Bloom’s Taxonomy and the Revised Taxonomy
- Operational Verb List by Cliff Adelman
- Learning Goals and Their Role in Course Design
- Evaluating the Strength of Learning Outcomes
- Information on Writing SMART Learning Outcomes


The following resources provide a foundational understanding of assessment to inform the way you approach assessment work. Included are discussions on accreditation, assessment for accountability vs improvement, sources of evidence, and the relationship between assessment and pedagogy.
- A Brief History of Assessment
- Assessment, Accountability, and Improvement: Revisiting the Tension
- Regional Accreditation and Student Learning Outcomes: Mapping the Territory
- Higher Education Quality: Why Documenting Learning Matters
- Unpacking Relationships: Instruction and Student Outcomes
- Changing Institutional Culture to Promote Assessment of Higher Learning
- Using Evidence of Student Learning to Improve Higher Education


In order to know where you are going, we think it is helpful to know where we’ve been and currently are as a field. These resources provide an overview of the assessment landscape using findings from three iterations of a national NILOA survey of provosts, and more.
- Assessment that Matters: Trending toward Practices that Document Authentic Student Learning
- Knowing What Students Know and Can Do: The Current State of Student Learning Outcomes Assessment in US Colleges and Universities
- More than You Think, Less than We Need: Learning Outcomes Assessment in American Higher Education
- NILOA at Ten: A Retrospective


Simply transplanting assessment practices from another institution into yours does not mean they will yield similar results. However, the lessons learned and questions asked along the assessment process can be adapted to fit your context. The following examples provide thoughtful examples and considerations to make when conducting assessment and using evidence for improvement.
- Assessment 2.0: An Organic Supplement to Standard Assessment Procedure
- Using Assessment Results: Promising Practices of Institutions that Do It Well
- All-in-One: Combining Grading, Course, Program, and General Education Outcomes Assessment
- A Simple Model for Learning Improvement: Weigh Pig, Feed Pig, Weigh Pig
- Using ePortfolio to Document and Deepen the Impact of HIPs on Learning Dispositions


There are various stakeholders whom play a role in assessment. The following resources provide insight on considerations different stakeholders should make in assessment.
- What Faculty Need to Know About Assessment
- What New Student Affairs Professionals and Those New to Assessment Need to Know
- Governmental Policy and the Systemic Assessment of Student Learning
- The Governing Board’s Role in Assessment
- What Students Need to Know About Assessment
- A Portrait of the Assessment Professional in the United States:
Results from a National Survey - Gaining Ground: The Role of Institutional Research in Assessing Student Outcomes and Demonstrating Institutional Effectiveness
- Creating Student-Centered Learning Environments and Changing Teaching Culture: Purdue University’s IMPACT Program


A significant element of assessment is transparency: sharing assessment data with various stakeholders and being open about the process. The following resources can help focus your thinking around transparency as it relates to assessment.


Learning frameworks are tools that help specify learning outcomes or skills that learners have acquired while facilitating their transfer from one context to the next. Learning frameworks play an important role in determining what students know and can do. The following resources provide an overview of learning frameworks and their relation to assessment.
- Interconnected Learning Frameworks
- Learning Frameworks: Tools for Building a Better Educational Experience
- The Degree Qualifications Profile: What It Is and Why We Need It Now
- The Lumina Degree Qualifications Profile (DQP): Implications for Assessment
- Using the Degree Qualifications Profile to Foster Meaningful Change
- Tuning: A Guide for Creating Discipline-Specific Frameworks to Foster Meaningful Change


Assessment Modules
Seven New England colleges and universities formed the Learning Assessment Research Consortium (LARC) and developed online modules on assessment to be utilized for professional development within colleges and universities nationally. NILOA is pleased to house the great work of the Consortium on our website. All LARC developed materials and module content are under a creative commons license.
Background: LARC is comprised of seven colleges and universities in New England that first came together during a “think tank” event. These institutions include: Suffolk University, Simmons University, Fitchburg State University, MGH Institute of Health Professions, Manchester Community College, St. Michael’s College, and Framingham State University. Four authors from the consortium: Chris Cratsley (Fitchburg State University), Jennifer Herman (Simmons University), Linda Bruenjes (Suffolk University), and Victoria Wallace (MGH Institute of Health Professions) familiar with multi-day course design institutes, developed a set of customizable online assessment modules to meet the needs of administrators, deans, chairs, faculty, and staff assessing student learning at the institutional, program, and course levels. Thanks to a generous grant from The Davis Educational Foundation, LARC completed a three-year project to develop six modules on a variety of topics related to assessment: Benefits & Barriers, Demystifying Assessment, Goals & Objectives, Gathering Data, Use of Assessment Data, and Sustainable Practices. In year three of the grant, the consortium partnered with NILOA as a platform for free online access, making these modules readily available. LARC and NILOA are continuing to explore ways to help institutions use these modules to create sustainable assessment practices on their campuses.
![]()
Introduction
Benefits and Barriers Facilitation Guide

Intended Audience
This module offers an introduction to the concept of assessment in higher education. It is intended for:
- Faculty at all levels; and/or
- Staff, administrators, as well as other institutional stakeholders.

Goals
This module is designed to help participants:
- Understand the benefits of assessment for different constituencies associated with your institution.
- Recognize the potential role of assessment data in decision-making across different levels of your institution.
- Explore the uses of assessment data for institutional improvement and accountability in your own role at your institution.
- Predict the common concerns and challenges that arise when institutions engage in the process of assessment.
- Envision how to better support and maintain the assessment process as a cycle of inquiry in your role at your institution.
![]()
![]()
Objectives
Upon completion of this module, participants will be able to:
- List various benefits of assessment for students, instructors, and other institutional stakeholders.
- Identify the impacts of the assessment process at various instructional and institutional levels.
- Describe how assessment is useful for institutional improvement.
- Recognize best practices for effectively using the assessment process to make evidence-based decisions.
- Categorize common barriers to effective assessment.
- Choose appropriate responses to common barriers of effective assessment.
Chapter 1: Benefits of assessment

Warm Up Activity: Write as many benefits of assessment as you can think of in one minute.
Were you able to come up with more than ten? Are these benefits things you have experienced or just read about?

The video shares the experiences of different faculty members and administrators on the benefits of assessment to improving teaching and learning in each of their respective roles.
While and after watching the video, write reflective responses to, or with colleagues discuss the following questions:
- What were some of the key themes that you heard/saw in the videos?
- Which benefits on your list were also mentioned by the faculty and administrators in the video?
- Which benefits mentioned in your video were not on your initial list? Did these benefits surprise you? If so, why?
- What differences did you notice in how the different types of positions (director of assessment, dean or chair, and faculty member) benefited from assessment? How did they use data similarly or differently?
If you have generated additional ideas after watching and reflecting on the video, please add them to your initial list.
Research on the Benefits of Assessment: Three Common Results from Assessment
In her book, Assessment Clear and Simple (2010), Barbara Walvoord explains that the three most common actions (or benefits) resulting from assessment are:
- “Changes to curriculum, requirements, programmatic structures, or other aspects of the students” program of study
- Changes to the policies, funding, and planning that support learning
- Faculty development (p. 5).
Walvoord also explains that while it is too complex to study the benefits of assessment on a national scale, within specific institutions there are numerous examples of how assessment is “used as a tool to help faculty and institutions make decisions that affect student learning” (p. 10). She argues that informed decision-making is perhaps the best benefit of assessment and why it has such potential to help improve teaching and learning.

Activity: From Application to Practice
Four scenarios appear below that describe potential situations in which higher education professionals may be asked to explain the benefits of assessment. Select the scenario most likely for your current role and create a response based on the directions in the prompt.
1. The Committee Reassignment
You are a tenured faculty member and currently the assessment coordinator for your department. Your Dean has asked whether you would be able to serve on a different committee and put the department’s assessment work “on hold” for a few years. Write an email to your Dean explaining why your current assessment work is important and why it is beneficial for you to maintain this assessment role for students, your colleagues, and other stakeholders.
2. The Board Presentation
As director of assessment, you are asked to give a 15-minute presentation to the Board of Trustees (which has a number of new members who are new to academia), explaining what student learning assessment is and what the benefits of this work are to improving teaching and learning at the institution. Create an outline with your key talking points in preparation for this presentation.
3. A Curmudgeonly Colleague
During one of your department’s weekly faculty meetings, one of your colleagues is complaining about the time and effort needed to complete that year’s assessment report. After the meeting, you learn that the chair has tasked you and the curmudgeonly colleague with writing and sharing this year’s report. Write an email to this colleague, sharing the news of the assigned task and getting him/her “on board” with the assignment by explaining why this work is an important use of time.
4. Budget Request
You are the Dean of your school, and you are preparing a budget for the next fiscal year that includes a request for additional resources for assessment (including a new line for an administrative assistant, funding for an annual assessment retreat, and resources for professional development). Write a paragraph arguing why these requests are justified and a worthwhile use of limited funds.
Final Reflection: After completing the activities, reflect on your final product by responding to the questions below. You can do this exercise through either individual reflective writing or discussion with a partner.
- While creating the final product, on which points did you decide to focus and why?
- What questions or challenges arose for you when completing this task?
- For group dialogue: What is one piece of advice or information that you would give your colleague if they asked for feedback on how to strengthen the argument in their final piece?

Resources
Walvoord, B. E. (2010). Assessment clear and simple: A practical guide for institutions, departments, and general education. (2nd ed.). San Francisco, CA: Jossey-Bass.
Chapter 2: What is the purpose of assessment?
Warm Up Activity: What has been your direct experience with gathering assessment data?
Open the following file: Possible Experiences with Gathering Data
Check off all of the activities from the list that you have done before and write down other tasks that you have completed that do not appear on the list.
Possible experiences with gathering data:
- Designed an assessment instrument to be used to evaluate student learning in an individual class, such as rubric, essay prompt, or multiple-choice exam.
- Used an assessment instrument to evaluate student learning in a single class.
- Used short, ungraded activities during class to collect data on student learning (brief response writing, clickers, etc.).
- Designed an assessment instrument to be used to evaluate student learning across multiple sections of a single class.
- Used an assessment instrument to evaluate student learning across multiple sections of a single class.
- Collected samples of student work from multiple classes to evaluate for assessment purposes.
- Engaged in sampling student work (aka, randomly selecting 15% of student essays from the sophomore class).
- Helped design an assessment plan for your department, school/college, or general education.
- Helped design or manage the electronic collection of assessment data, such as through an e-portfolio.
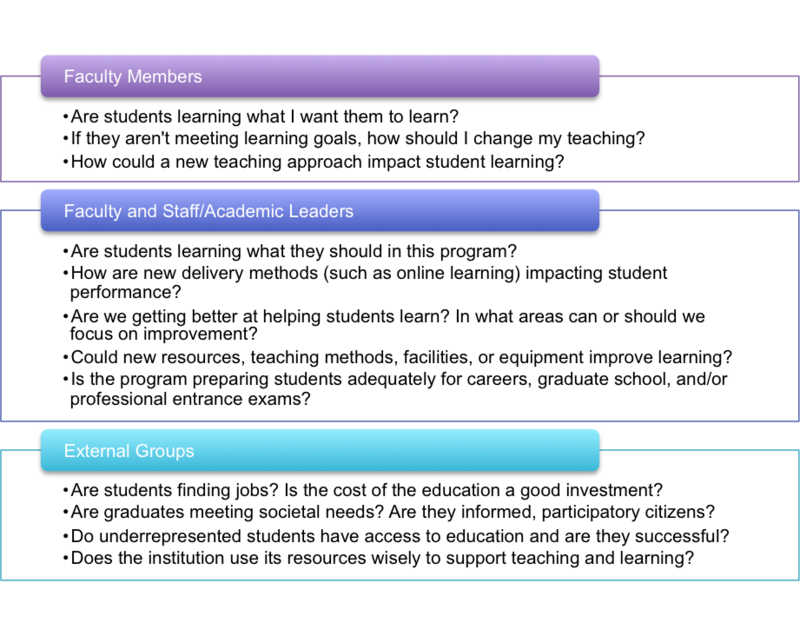
Now that you have reflected on how you have engaged with gathering assessment data, it is time to consider why different people invest the time and effort into these activities. Below, you will find a chart in which different stakeholders at one institution have explained the top three reasons why they gather assessment data.
Review this chart and then answer the reflection questions.
| Role in Institution | Purpose of Gathering Data |
|---|---|
| Faculty Member | Monitor progress, evaluate learning outcomes, and identify student needs. |
| Department Assessment Coordinator | For continuous improvement to our curriculum, programs, and services; to better understand our students; and for compliance with accreditation standards. |
| Department Chair | To assess the degree to which students learned and could apply the concepts taught in class. To assess whether teaching methods met the different learning styles of the students. To identify areas of teaching (or topics covered) that students felt could be improved-their comments help with figuring out how they can be potentially improved. |
| Director of Assessment | I gather data to give our institution insights into the strengths and weaknesses in student learning that need to be addressed through curricular revisions. Data also provides individual programs with data on how their students are learning to support their self-studies, accreditation reporting and curricular revisions. It also provides individual programs and the institution as a whole with data on how students are learning to act on and report those actions as part of our institutional accreditation process. |
| Faculty Chair of Institution-Wide Assessment Committee | I gather assessment data to gain feedback on my teaching and make data-based decisions. If student learning is strong, I keep doing what I’ve been doing. If my data show there are weaknesses in student learning, I make curricular and pedagogical changes to improve student learning. |
| Associate Vice Provost for Assessment |
OR:
|
| Director of Teaching Center | Collecting assessment data on student learning helps us decide on what types of teaching workshops to offer to faculty. It also helps us coach faculty members to see the ‘bigger picture’ of student learning so that they can make wise choices when revising a course or deciding whether to implement a new teaching strategy. Assessment helps us see whether changes should be made at the course or the curriculum level. |
| General Education Director | As we roll out a new program, collecting assessment data has allowed us to tweak classes each year, preventing the entrenchment of ineffective practices. Embedded assessment is a reassuring and important component of the new program for faculty. We can demonstrate that curricular oversight is happening and leading to change, when necessary. |
| Dean with External Accrediting Body | I gather data to: Help insure each of the departments within my division are satisfying their assessment requirements to support programmatic and institutional accreditation. Justify proposals for new grant funding or for reporting on existing grants using student learning data. Provide data on our divisional contributions towards individual goals within the Strategic Plan that can be evaluated using learning assessment data. |
| Provost | I gather data to: Evaluate specific academic initiatives such as the redesign of our developmental mathematics pathways. Ensure that we are meeting our institutional accreditation requirements for assessment. As a state institution, we also utilize assessment data to respond to system-wide initiatives or inquiries for the Department of Higher Education. |
Activity: Reflecting on Shared Experiences
After reviewing the chart, write reflective responses to, or with colleagues discuss the following questions:
- Find the role that most closely matches your own. Do you agree with the insights shared in the example? Did anything strike you as similar to or different from your own experience?
- What are some points that are missing from this list?
- What are three other stakeholders who could be added to this list? What would be their top purposes for gathering data?
- For each of the roles above, consider who benefits from their purpose of gathering data. Are the benefits what you would expect or hope for? Is anything missing?
Research on the Purpose of Gathering Assessment Data
In Assessing Student Learning: A Common Sense Guide (2nd Ed.), Linda Suskie divides the purposes of gathering student learning assessment data into two broad categories: improvement and accountability (p. 58).
The following list draws from Suskie (p. 58-61), Maki (p. 20-22), and the authors’ experiences to organize purposes for gathering assessment data by stakeholder type:
Improvement
Purpose for Students:
- To help them understand how to focus their time and energy around learning.
- To motivate them to perform well.
- To understand their strengths and weaknesses.
- To keep stock of and reflect on their progress as learners.
Purpose for Faculty:
- To facilitate discussion on what you teach and why.
- To clarify common expectations and performance standards.
- To encourage a collaborative approach to improving teaching.
- To create alignment between and among courses.
- To inform future and ongoing research on teaching.
- To make informed decisions about how to use limited resources.
Purpose for Academic Leadership and Curriculum Improvement:
- To improve the coherence of academic programs.
- To create benchmarks for future analysis.
- To add insight into how the sequencing of courses impacts learning.
- To provide feedback to help faculty decide if and how the curriculum should be changed.
- To bring “neglected issues to the forefront,” such as “outdated general education curricula . . . a fragmented and incoherent curriculum, or outmoded pedagogies” (Suskie, 2009, p. 59).
- To improve institutional structures and effectiveness.
- To educate institutional stakeholders about the results of new initiatives or changes in academic programs.
- To inform strategic planning and institutional budget decisions.
Accountability
Accountability involves demonstrating the quality and effectiveness of the current curriculum, teaching, and learning to “concerned audiences” (p. 58). These can include external audiences, such as regional accrediting organizations and discipline-specific accrediting organizations (often for professionally-oriented programs such as business, social work, or nursing). Other external audiences can include legislatures, external funders, parents, prospective students, and the general public. Internal audiences include governing boards, assessment oversight committees, and various levels of leadership within the organization.
Activity: Application to Practice
Now that you have reviewed research and an example from colleagues on the purpose of gathering assessment data, it is time to apply these principles to your own institutional context. In the chart below, first brainstorm any stakeholders at your institution or within your unit (school, department, etc.) that would have a purpose for gathering assessment data. Then, in the second column, for 3-4 of these stakeholders, list the types of decisions that they would be making with assessment data or the types of purposes that they would have for gathering data. Open the Activity Worksheet to record your answers.
| Role in Institution | Purpose of Gathering Assessment Data |
|---|---|
Final Reflection
After completing the activities, reflect on your final product by responding to the questions below. You can do this exercise through either individual reflective writing or discussion with a partner.
- While reviewing your list of stakeholders, did you notice any differences between what you included or did not include and those included on the sample chart? Why do you think you included the people who you did?
- How did the purposes for gathering data vary (or not vary) by the person’s role within the institution?
- For group dialogue: Compare your chart with a colleague’s. What similarities and differences do you see? Why?
Resources
Maki, P. L. (2010). Assessing for learning: Building a sustainable commitment across the institution. (2nd ed.). Sterling, VA: Stylus.
Suskie, L. (2009). Assessing student learning: A common sense guide (2nd ed.). San Francisco, CA: Jossey-Bass.
Chapter 3: Why are assessment data useful?
Warm Up Activity: Respond to the following questions through either individual reflective writing, or small group discussion:
- How have you used assessment data in the past? In what context?
- How was it useful?
- What decisions did it help you or your department make?
This video shares the experiences of different faculty members and administrators on the usefulness of assessment data in informing decision-making, curricular change, and improving teaching and learning in each of their respective roles.
Activity: Reflecting on Shared Experiences
After watching the video, write reflective responses to, or with colleagues discuss the following questions:
- What were some of the key themes that you heard/saw in the videos?
- Which uses on your list were also mentioned by the faculty and administrators in the video?
- Which benefits mentioned in the video were not on your initial list? Did these benefits surprise you? If so, why?
- Did the distinct positions (director of assessment, dean or chair, and faculty member) benefit differently from assessment? How did they use data similarly or differently?
If you have generated additional ideas after watching and reflecting on the video, please add them to your initial Warm Up exercise.
Research on Why Assessment Data are Useful
The Usefulness of Assessment Data
Suskie (2009) explains that there is a lack of published research on the usefulness of assessment data because assessment is “context specific rather than generalizable, informal rather than rigorous, and designed to inform individual rather than general practice”(p. 60). Because this work is not published in peer-reviewed journals, “there is no way that the hundreds, if not thousands, of these kinds of success stories can be aggregated” (p. 61), although there are a few books containing collections of case studies (Banta, Lund, Black, & Oblander, 1996; Bresciani, 2006, 2007). However, as Suskie notes, these institution-specific uses of assessment data are happening on a regular basis.
Rather than delve into institution-specific examples, we have listed below the types of decisions that are often made using assessment data. This is only a sample of the many possible uses of assessment data.
The usefulness of assessment data can also be thought of in terms of the level of the curriculum that it has the potential to impact or change. Assessment data is typically collected at multiple levels for that reason:
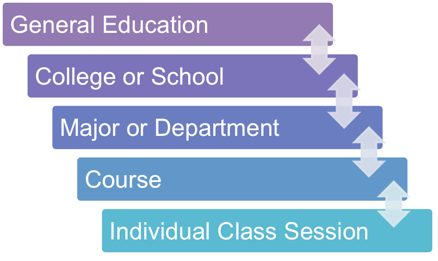
Often, data collected at a specific level is used to impact change within that level. However, many institutions collect and review data on institution-wide learning objectives (such as writing or critical thinking, for example) from across multiple levels of the institution in order to inform institution-wide decisions, such as General Education reform, topics for faculty professional development, or allocation of resources for new or enhanced student services.
Activity: Application to Practice
Create a list of at least ten possible uses of assessment data for your particular role at your institution. Try writing them as questions that you might want to have answered, and try to be as specific as possible. These do not necessarily have to be questions that you would answer now, but that you might need to answer at some point in the future in your role. Here are some examples of possible questions:
- Should we reduce the maximum class size in Writing 101 from 18 to 15 students?
- Should we rehire the adjunct faculty member to teach two sections of Introduction to Biology in the Spring?
- Are the first two courses in the Philosophy major in the right sequence?
- What topics should we focus on for our department’s professional development day?
- Are enough students demonstrating sufficient competency in their understanding of medical calculus, or do we need to add a required 1-hr course to the curriculum?
- Is my lesson plan from today effective?
Next, for each of your ten questions, write down a piece of assessment data that you think might be most useful to you in answering that question.
Final Reflection
After completing the activities, reflect on your ten questions by responding to the questions below. You can do this exercise through either individual reflective writing or discussion with a partner.
- While reviewing your list of questions, did you notice whether they tended toward improvement or accountability? Were your questions focused on improvement within the classroom, major or department curricular issues, personnel or resource decisions, or another area?
- Were your questions focused on improving a certain level of the institution (aka, classroom-level, department-level)?
- What types of data did you identify as being helpful and why? Are these types of data collected already by your institution?
- For group dialogue: Compare your questions with a colleague’s. What similarities and differences do you see? Why?
Resources
Banta, T. W., Lund, J. P., Black, K. E., & Oblander, F. W. (1996). Assessment in practice: Putting principles to work on college campuses. San Francisco, CA: Jossey-Bass.
Bresciani, M. J. (2006). Outcomes-based academic and co-curricular program review: A compilation of institutional good practices. Sterling, VA: Stylus.
Bresciani, M. J. (Ed.). (2007). Assessing student learning in general education: Good practice case studies. Bolton, MA: Anker.
Chapter 4: What are some concerns about assessment?
Warm Up Activity: Generate a list of issues and concerns about the assessment process that you have frequently heard raised on your campus.
The video shares the experiences of different faculty members and administrators on the usefulness of assessment data in informing decision-making, curricular change, and improving teaching and learning in each of their respective roles.
Activity: Reflecting on Shared Experiences
After watching the video, write reflective responses to, or with colleagues discuss the following questions:
- What were some of the key themes that you heard/saw in the video?
- Which issues or concerns on your list were also mentioned by the faculty and administrators in the video?
- Which issues or concerns in the video were not on your initial list? Did these barriers surprise you? If so, why?
- Did the individual positions (director of assessment, dean or chair, and faculty member) struggle with assessment? Did they encounter different types of barriers?
If you have generated additional ideas after watching and reflecting on the video, please add them to your initial pre-writing exercise.
Research on the Barriers to Assessment
A wide variety of common barriers to effective assessment practices have been enumerated in the literature (Bresciani 2006, Bresciani et al. 2004).
1. Building a campus culture of assessment
While assessment concerns are often described in terms of the threat they represent to academic freedom and academic autonomy, these issues often mask a lack of shared understanding of why and how the campus or department is engaging in the assessment process in the first place. Faculty staff and administrators may struggle with:
- Understanding what it is
- Not knowing how to do it
- Not prioritizing values/goals
- Fear of change, of unknown
- Confusion
- Avoiding being labeled as “one of them”
2. Establishing institutional support for assessment
Time is often cited as the biggest barrier to many of our campus initiatives. Assessment is no different and in fact may present greater issues as it is often seen as being ‘added on’ to the regular responsibilities of faculty and staff. While this may be addressed in part through building a more effective campus culture of assessment, issues related to time, resources and the incentives for engaging in assessment can include among other things:
- Finding Time to engage
- Finding time to document
- Getting support from top leadership
- Lack of organizational incentives
- Concern over faculty contracts ‘a.k.a.’ unions
3. Developing strategies to collect data
Even with the commitment and resources necessary, effective assessment presents additional challenges as faculty and staff must gather useful data about student learning. The barriers to collecting data can include:
- Difficulty with requesting data
- Difficulty with finding data
- Lack of truly authentic instruments and evidence- gathering techniques
4. Effectively interpreting and analyzing data
Once assessment data has been collected, there are often challenges associated with making meaning of the data. The challenges of understanding how to work with data that may involve small sample sizes and non-standardized sampling techniques can include:
- Difficulty in identifying how to use data
- Difficulty interpreting data
- Challenge of benchmarking against external standards
- Concern over student motivation and involvement
5. Finding ways to use data for improvement
As we come to terms with any meaningful patterns and potential limitations in the data we have collected, we often also struggle with using this data to inform changes on our campuses, in our departments and in our courses. The barriers to making these changes can include:
- Not using results to inform decision-making
- People who prefer anecdotal decision-making
- Lack of communication about what has been learned
6. Sustaining the assessment process
Finally, while it is important to establish institutional support, it is also critical to maintain that support in order to establish ongoing, effective assessment. In addition to maintaining institutional support it is critical to address issues related to:
- Challenge of managing the assessment process
- Avoiding burnout
Activity: Application to Practice
Struggling with Assessment
Four scenarios appear below that describe potential situations in which a campus is struggling with assessment. Select the scenario most likely for your current role and identify some of the potential issues that may have been affecting the outcome in that scenario. Draw on any of your experiences and the range of issues discussed previously and discuss what could be done to address the issue(s).
1. The Cranky Committee
You are a tenured faculty member and currently the assessment coordinator for your department. You have just completed an assessment cycle and have shared the data you collected with the curriculum committee. At the meeting committee members complained that this was a waste of time, that they could not see how this data would be useful to them, and that it did not offer them anything they did not already know.
2. The Difficult Department
As director of assessment, you are asked to work with a department that is struggling to get its assessment system in place. As you go to meet with the department, you are faced with difficult questions about why they should be engaging in this work in the first place, what is in it for them, and how on earth they can be expected to quantify something like student learning when after all, they know it when they see it.
3. A Curmudgeonly Colleague (continued from Chapter 1)
During one of your department’s weekly faculty meetings, one of your colleagues is complaining about the time and effort needed to complete that year’s assessment report. You have tried to explain to the colleague the benefits of engaging in this assessment work, but the colleague cannot get past the idea that this responsibility has been foisted on them when they have so many more important things to do.
4. Budget Request (continued from Chapter 1)
You are the Dean of your school, and you prepared a budget for the next fiscal year that included a request for additional resources for assessment (including a new line for an administrative assistant, funding for an annual assessment retreat, and resources for professional development). However, this request was not funded. Little explanation was offered other than that the overall budget is tight and resources needed to be used in more effective ways.
Final Reflection
After completing the activities, reflect on your final product by responding to the questions below. You can do this exercise through either individual reflective writing or group discussion.
- As you considered what might be creating the barrier to assessment in the scenario, on which potential issues and challenges did you decide to focus and why?
- What questions or challenges arose for you when completing this task?
- For group dialogue: What is one potential issue or challenge that might be contributing to the outcome in the scenario that your colleague did not discuss?
Resources
Bresciani, M. J. (2006). Good Practices in Outcomes-based Assessment Program Review. Sterling, VA: Stylus.
Bresciani, M. J., Zelna, C. L., & Anderson, J. A. (2004). Techniques for Assessing Student Learning and Development in Academic and Student Support Services. Washington D.C.: NASPA.
Chapter 5: What are steps that an institution can take to make assessment useful?
Warm Up Activity
Think about the assessment processes that take place on your campus. What works well that has allowed your campus to benefit? What has not worked as well that has caused some of the concerns raised in the previous section?
Cycle of Inquiry
The assessment process is frequently represented as a loop or ‘cycle of inquiry’ in which institutional contributors reaffirm agreement about what they want to uncover with regard to student learning, and how to gather, represent, and interpret appropriate data collectively. Institutional contributors then collaborate to innovate teaching and learning processes before reentering the assessment cycle to evaluate those changes (Maki, 2010). Assessment is truly useful to a campus when it involves this full cycle of inquiry, culminating in innovations for teaching and learning. The potential barriers to effective assessment organized in the prior section can be further subdivided into those that represent individual elements of the cycle of inquiry leading to improvement, and those that are essential for maintaining the cycle of inquiry:
Elements of the Cycle of Inquiry
- Developing strategies to collect data
- Effectively interpreting and analyzing data
- Finding ways to use data for improvement
Maintaining the Cycle of Inquiry
- Building a campus culture of assessment
- Establishing institutional support for assessment
- Sustaining the assessment process
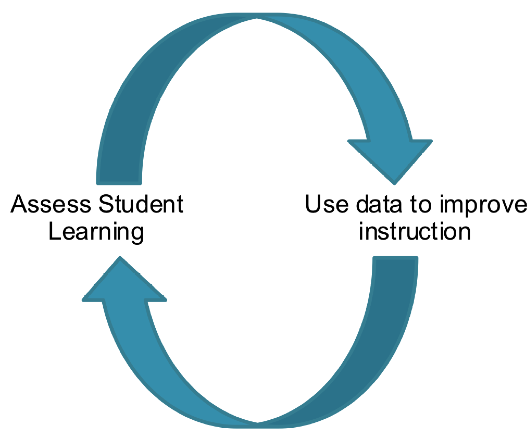
While the Cycle of Inquiry can be portrayed as a closed loop, (and in fact, the process of reentering the assessment cycle once changes have been made in response to assessment data is often termed ‘closing the loop,’) maintaining the cycle of inquiry, and in particular sustaining the assessment process, requires revisiting and revising the way things are assessed on an ongoing basis.
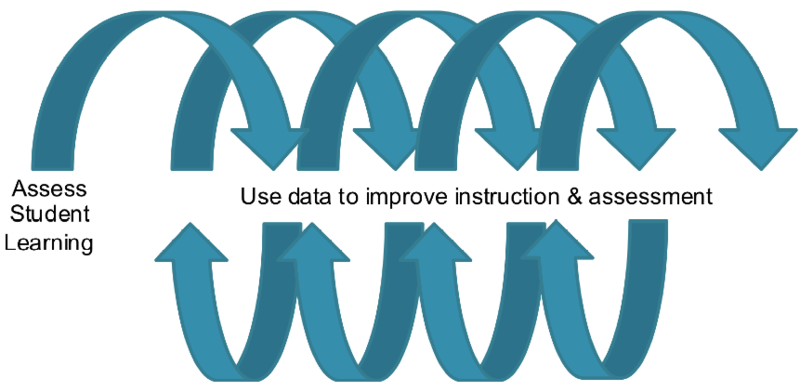
At its most basic, the closed loop of assessment can be represented as follows:
In contrast, when viewed as an ongoing cycle of inquiry that must be revisited and revised in new ways it can be represented as follows:
Activity: Reflecting on What Does and Does Not Work On Your Campus
Consider what you wrote in your initial reflection and write reflective responses to, or with colleagues discuss the following questions:
- What works on your campus that can be considered part of the elements of the cycle of inquiry?
- What does not work well on your campus that can be considered elements of the cycle of inquiry?
- What works well on your campus that helps to maintain the cycle of inquiry?
- What does not work well on your campus to maintain the cycle of inquiry?
Case Studies
The following are case studies of how institutions have attempted to improve the cycle of inquiry (to be included as separate linked documents). As you read these, reflect on the changes they made that improve, support, or maintain the cycle of inquiry. You may also want to brainstorm things they did not do, but could have done to improve the cycle of inquiry.
Case Study 1: Building a Campus Culture of Assessment through Institutional Support
Case Study 2: The Multi-State Collaborative for Learning Outcomes Assessment
Case Study 3: Finding Sustainable Ways to Use Data for Improvement
Activity: Application to Practice
Using the lists of ways to improve the cycle of inquiry and overcome potential barriers that you generated as you read the case studies, create a list of at least ten possible steps you might take to improve the cycle of inquiry from your particular role at your institution. Try grouping this list into categories of either improving or supporting the cycle of inquiry.
Final Reflection:
After completing the activities, reflect on your ten questions by responding to the questions below. You can do this exercise through either individual reflective writing or discussion with a partner.
- While reviewing your list of possible steps, did you notice whether they tended toward improving steps of the cycle or improving support for the cycle?
- Were your steps focused on improving a certain level of the institution (aka, classroom-level, department-level)?
- For group dialogue: Compare your steps with a colleague’s. What similarities and differences do you see? Why?
Resources
Maki, P. L. (2010). Assessing for learning: Building a sustainable commitment across the institution. (2nd ed.). Sterling, VA: Stylus.
Conclusion and resources

Summary of Key Points
Benefits of Assessment
- Informed decision-making is one of the best benefits of assessment.
- Three common actions resulting from assessment-informed decision-making include curricular changes, policy changes, and faculty development.
- There are a variety of examples of how assessment is beneficial within specific institutions.
- Different institutional stakeholders find assessment to be beneficial in different ways, depending on their role within the institution.
Purpose of Gathering Assessment Data
- Different stakeholders vary in their reasons for gathering assessment data.
- The purposes of gathering assessment data can be divided into two broad categories: improvement and accountability.
- Improvement includes helping students improve as learners, helping faculty improve as teachers, and helping academic leadership improve curricula and academic programs.
- Accountability involves demonstrating the quality and effectiveness of the current curriculum, teaching, and learning to both external and internal audiences.
Usefulness of Assessment Data
- Different stakeholders find assessment data to be useful to their work in different ways.
- The usefulness of assessment data is specific to institutional context and individual practice.
- Assessment data is useful in impacting a curriculum at multiple levels, from an individual class session to the General Education curriculum.
- Data collected at a specific level is usually used to impact change within that level, although data can be collected across multiple levels to inform institution-wide decisions.
Concerns about Assessment
- Assessment is often perceived as unfamiliar, confusing, new, unimportant and ‘someone else’s job’ impeding the development of a campus culture of assessment.
- Assessment is not always given the time and attention needed, or the resources and incentives through campus leadership, promotion and tenure decisions and union contracts.
- Campuses often struggle with determining where and how to collect the necessary assessment data, and find that the existing assessment instruments available don’t accurately capture what their students know and can do.
- Campuses may struggle with reaching consensus on the meaning of the data given concerns over the instruments used, the students sampled, identifying appropriate levels of student learning, and the level of engagement of students.
- Campuses may fail to incorporate the data into their decision-making processes, weighting anecdotal data more heavily than the assessment data, and failing to communicate the assessment data effectively across the campus.
- Assessment is often engaged in sporadically rather than systematically on a campus, creating bouts of intense but unsustainable activity and ultimately burnout.
Making Assessment Useful
- Assessment should be viewed as an ongoing cycle of inquiry into student learning in which the assessment data is used both to improve teaching and learning and to improve the assessment process itself.
- Improving the cycle of inquiry can involve both improving the individual steps of the cycle and creating campus policies and procedures that help to maintain that cycle of inquiry over time.
- Improving the steps of the cycle can involve improving the approaches to collecting data, the analysis, interpretation and communication of the data, and the ways the data is used for improvement.
- Improving the support for the cycle of inquiry can involve creating a culture of assessment, improving institutional support for assessment and insuring that this support and campus climate is properly sustained over time.
Reflection
- Return to your list of assessment benefits. Which are the most relevant for your particular role? How can you remain mindful of this list as you do your assessment work?
- Reflecting on the purposes for gathering data, did you discover a purpose for your work that you had not previously considered? How can you begin gathering data for this purpose?
- What were your insights into why people in other roles gather data at your institution? In what ways did this shed light on why certain processes happen at your institution?
- Write three questions that assessment could be useful in answering.
- Identify three of the biggest barriers to assessment that you face at your institution.
- If you were to do something to improve assessment at your institution, what would be your first three steps?
Cited & Additional Resources
Banta, T. W., Lund, J. P., Black, K. E., & Oblander, F. W. (1996). Assessment in practice: Putting principles to work on college campuses. San Francisco, CA: Jossey-Bass.
Bresciani, M. J. (2006). Outcomes-based academic and co-curricular program review: A compilation of institutional good practices. Sterling, VA: Stylus.
Bresciani, M. J. (Ed.). (2007). Assessing student learning in general education: Good practice case studies. Bolton, MA: Anker.
Maki, P. L. (2010). Assessing for learning: Building a sustainable commitment across the institution. (2nd ed.). Sterling, VA: Stylus.
Suskie, L. (2009). Assessing student learning: A common sense guide (2nd ed.). San Francisco, CA: Jossey-Bass.
Walvoord, B. E. (2010). Assessment clear and simple: A practical guide for institutions, departments, and general education. (2nd ed.). San Francisco, CA: Jossey-Bass.
Introduction
Demystifying Assessment Facilitation Guide
LARC Beta-Testing Institutional Example 1
LARC Beta-Testing Institutional Example 2
LARC Beta-Testing Institutional Example 3
Audience
This module offers an introduction to the vocabulary of assessment in higher education. It is intended for three main audiences: faculty, staff, administrators, as well as other institutional stakeholders who:
- Consider themselves new to the assessment conversation;
- Are already involved in assessment efforts, but would like to strengthen their understanding of assessment terminology; and/or
- Have an advanced understanding of assessment, but who are charged with training or educating their peers and colleagues about assessment.
Goals
This module is designed to help participants:
- Recognize their current involvement in assessment activities.
- Learn basic assessment terminology and how it varies from institution to institution.
- Determine what assessment language is appropriate for their institution.
- Analyze differences and similarities between assessment, grading, and evaluation.
- Understand the foundational frameworks related to assessment.
Objectives
Upon completion of this module, participants will be able to:
- Define assessment.
- Articulate the differences between assessment and evaluation.
- Differentiate between assessment and evaluation activities.
- Define terminology related to assessment.
- Define terminology related to data gathering methods and tools.
- Compare foundational frameworks for assessment commonly used in higher education.
Chapter 1: What does assessment mean?
Warm Up Activity
Whether you are a faculty member, department chair or assessment director, you have been involved in assessment in one way or another. As a warm up to this module, consider some of the assessment activities that you already do.
Using the chart below, indicate whether you or someone on your campus is completing any of the following. Use the Comment column to add clarifying language. For example, if you are unsure of what the term means or if you plan to complete this activity in the future, make a note.
| Activity | We Do This | We Don’t Do This | Comment |
|---|---|---|---|
| Establish clear, measurable learning goals and objectives. | |||
| Align course, program and institutional learning goals and objectives. | |||
| Ensure that students have multiple opportunities to meet the learning objectives. | |||
| Ensure that learning objectives are mapped to courses for different levels of expertise. | |||
| Systematically collect evidence that students are meeting course learning objectives. | |||
| Analyze collected evidence to understand how well students are meeting learning objectives. | |||
| Use analysis of evidence to redesign learning activities to increase the likelihood that students will meeting learning objectives. | |||
| Require assessment in program review. | |||
| Embed assessment of learning in institutional initiatives (retention, technology, online learning, learning communities). | |||
| Review course goals and objectives to meet professional standards. |
How do you already ‘do assessment’?
“Assessment is the systematic collection of information about student learning, using time, knowledge, expertise, and resources available, in order to inform decisions that affect student learning” (Suskie, 2010, p. 2).
The good news is that assessment is not a new activity; it is something that educators do naturally, and it is not unusual for faculty to reformulate learning activities as a result of unexpectedly poor results of a formative or summative assessment. Ask yourself:
- When was the last time you were completely satisfied with student performance?
- When was the last time you did not tweak your course in some way?
- Why did you make these changes?
Perrine et al (2010) likens assessment to cooking: if you prepare a dish and it does not taste just right, how do you go about assessing the changes that need to be made to improve the dish? In assessment language, the changes you make to improve the dish are referred to as ‘closing the loop.’
Closing the loop is another way of describing ‘informed decision-making,’ which Barbara Walvoord (2004) suggests is the best benefit of assessment and why it has such potential to help improve teaching and learning. These improvements can range from a simple change to a course activity to complex changes in programs of study, policies that support student learning, and faculty development. For a more detailed explanation, refer to the Assessments Benefits & Barriers module.
In order ‘to do’ assessment at the institutional, program, and course level, we connect the outcomes to intended goals and objectives of learning; that is, what do we want our students to know, apply, or be able to do. As was mentioned earlier, many of you are most likely doing assessment on this wider scale. Using the table below, create an inventory of assessment activities you are doing on your campus. If you are unsure, invite others to join in on this activity.
Activity: How are you already collecting evidence?
How are you already collecting evidence that your students are meeting the institutional, program, and course levels? Using the table below, check the items that apply and indicate at what level the evidence applies.
| Activity | Course Level | Program Level | Institutional Level |
|---|---|---|---|
| Survey of student engagement | |||
| Final exams | |||
| Student presentations | |||
| Internship | |||
| Service-learning activity | |||
| Portfolios | |||
| Poster presentation | |||
| Multiple choice tests | |||
| Student surveys | |||
| Reflective writing | |||
| Class discussions | |||
| Admission rates to graduate school | |||
| Holistically scored writing sample | |||
| Focus groups |
What does it mean to assess student learning?
Linda Suskie (2009, p. 4) suggests that there are three components to assessing student learning:
- Establishing clear, measurable learning objectives
- Ensuring that stakeholders have sufficient opportunities to achieve objectives
- Systematically gathering, analyzing, and interpreting evidence to determine how well courses, practices, programs, or initiatives match expectations
Establishing clear, measurable learning objectives is an effective way to connect what students are learning to the larger picture established by the goals of the course, the program, and the institution. You may recall from the Goals and Objectives module that learning objectives describe what students will do as a result of the teaching and learning activities.
Learning objectives should answer the question: what is it you want your students to be able to do as a result of the course activities that will provide evidence that they have met the specified learning goal?
See Five Concepts to Remember in the Goals & Objectives module for common mistakes to avoid when preparing learning objectives.
Activity: Establishing Clear, Measurable Learning Objectives
Considering your role (faculty, department chair, assessment director), how would you assess student learning in your course, program, or institution?
Use the form below to outline clear, measurable learning objectives:
| Course, Program, or Initiative | Goal: Upon completion of this course, students will know/understand: | Objective: Students will be able to: |
|---|---|---|
| EXAMPLE: (Course) Business Communications Course | How to deliver effective written communications | Prepare a business report that is clear, logical, concise, grammatically correct, and targeted to a specific audience |
Ensuring that stakeholders have sufficient opportunities to achieve learning objectives could be accomplished through scaffolded assignments that begin by targeting low-level learning skills and progressively engage higher-level learning skills. A commonly used resource for identifying observable and measurable action verbs, while considering different cognitive levels and knowledge dimensions, is Bloom’s Taxonomy.
Refer to Bloom’s Taxonomy as you determine how to scaffold learning activities associated with meeting learning objectives in the following activity.
Activity: Ensuring Multiple Opportunities to Achieve Learning Objectives
What are the learning opportunities associated with a particular learning objective? In the example below, notice the range of learning activities. Consider what students need to be able to accomplish first (lower level thinking skills) before they are able to apply (higher level thinking skills) what they have learned. Use the form below to list learning opportunities that are designed to scaffold learning for your students in your course, program, or institution.
| Objective: Students will be able to: | Thinking Skills – Lower Level | Thinking Skills – Higher Level |
|---|---|---|
| EXAMPLE: Prepare a business report that is clear, logical, concise, grammatically correct, and targeted to a specific audience | -Define audience -Outline argument -Rewrite a sentence to make it concise -Edit paragraph for grammatical errors | -Write a thesis statement -Develop a plan for a business report -Prepare a rough draft of the business report -Peer review a business report |
Systematically gathering, analyzing, and interpreting evidence to determine how well courses, practices, programs, or initiatives match expectations will not only help you evaluate student learning, but these steps will also be instrumental as you decide what adjustments need to be made to your course, program, or institutional goals, outcomes, learning activities or assessments.
The gathering of assessment data takes careful planning before the learning experience begins. Assessment data can be generated throughout the learning experience and the data could be collected at any time before, during, and after the learning experience. A number of practical considerations also have the potential to impact the assessment process.
Some factors to consider when looking at assessment data are more fully explained in the Gathering Data module:
- Prioritize the evidence you are gathering
- Consider how the evidence you’ve gathered contributes to the broader campus-wide body of knowledge
- Look for a possible link to accreditation and regional assessment needs
When analyzing the data, consider:
- Factors that are related to the relevance of data
- The controllability of the data
- The quality (reliability and validity) of the data
Linda Suskie (2009) suggests a ‘toolbox’ of assessment instruments (exams, reflections, interviews, focus groups, etc.), because of their unique data gathering capabilities, will produce very different types of data . To get a more detailed understanding of data gathering processes, complete the Gathering Data module.
Activity: Gathering Data Through Assessment
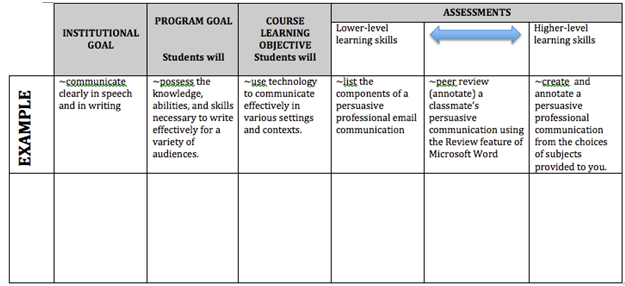
How will you collect evidence that reflects how your students have met the learning objectives of the course, program, and/or institution? Use the form below to show the link between institutional goals, program goals, and course learning objectives and assessments that span levels of learning skills.
NOTE: It is helpful to differentiate between assessment and grading:
- Grading focuses on individual students
- Assessment focuses on the entire cohort or class of students.
The next sections will elaborate on why grades alone will not yield the information that is needed to fully assess the learning of students in your course, program or institution.
Final Reflection
Now that you have had a chance to articulate what you already know about assessment by completing the exercises in this section, consider the difference between assessment of learning and grading. Think of a past assignment that you have either administered to your students or completed as a student.
- How well did the grade reflect how students met the learning objectives related to the assignment?
- Is there an additional way that you could have collected and analyzed the evidence that would have led to information about how well the learning objectives were met?
Resources
Maki, P. L. (2010). Assessing for learning: Building a sustainable commitment across the institution. Sterling, VA: Stylus.
Maxfield, L. (2010). Assessment is like a box of chocolates. In P. L. Maki (Ed.), Coming to terms with student outcomes assessment: Faculty and administrators’ journeys to integrating assessment in their work and institutional culture. Sterling, VA: Stylus.
Perrine, R., Sweet, C., Blythe, H., Kopacz, P., Combs, D., Bennett, O., Street, S., & Keeley, E. (2010). The transformation of a regional comprehensive university. In P. L. Maki (Ed.), Coming to terms with student outcomes assessment: Faculty and administrators’ journeys to integrating assessment in their work and institutional culture. Sterling, VA: Stylus.
Suskie, L. (2009). Assessing student learning: A common sense guide. Hoboken, NJ: John Wiley & Sons.
Walvoord, B. (2004). Assessment clear and simple. San Francisco, CA: Jossey-Bass.
Chapter 2: How is assessment related to evaluation?
Warm Up Activity
Check your understanding of assessment and evaluation. Which of the below do you identify as assessment and which do you identify as evaluation?
Self Assessment Activity
Differences and Similarities Between Assessment and Evaluation
Assessment
Assessment is gathering information to make a determination about something (i.e. a measurement of student learning). Assigning a grade to student work is not assessing. The goal of grading is to evaluate individual students’ learning and performance, where the goal of assessment is to improve student learning. Grading may play a role in assessment but there are also many ungraded activities in assessments (e.g. classroom assessment techniques aka “CATS”). Data collection for assessment should correlate directly to clearly defined targets, whether that be objectives or outcomes.
Assessment can happen at the course level, program level, or institutional level:
- Course level: assignments, activities.
- Program level: capstone experiences, field experiences, portfolios.
- Institutional level: competencies typically integrated in general education curriculum, majors, and student development programs.
Assessment activities include the continuous process of:
- Establishing clear, measurable learning objectives.
- Ensuring students have opportunities to exhibit achieving the learning objectives.
- Systematically collecting, analyzing, and interpreting data.
- Using data interpretations to increase the quality of learning.
Evaluation
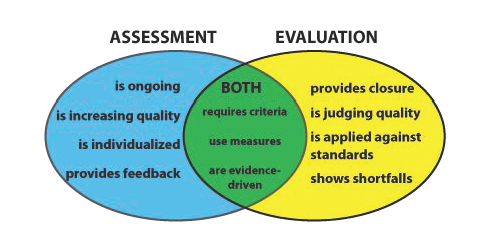
Assessment activities can be useful in and of themselves, but the data becomes more meaningful as part of evaluation. Evaluation is using assessment data to understand (level of success or value), judge, and/or improve current knowledge, services, and/or practices. Evaluation cannot be done well unless the assessment is sound (good assessment leads to good evaluation).
In order for this to happen, there needs to be alignment between assessment and evaluation. While assessment results guide us, evaluation allows us to make decisions. Here is a visual representation so that you can see how assessment and evaluation work together.
Evaluation allows us to answer questions such as:
- What are the strengths and weaknesses of teaching and learning strategies?
- What changes in goals are needed?
- Can we justify the program’s expense?
- What is working well in the program and how can we still improve it?
- Which teaching and learning strategies should we change?
- Have students achieved the established learning goals?
Evaluation is about ‘closing the loop’ in the assessment process. This is typically the most difficult part of the assessment process, and is often abandoned or forgotten. Closing the loop can refer to many different outcomes and actions that result from reviewing the assessment data. Evaluation activities include:
- Reviewing assessment data.
- Drawing conclusions.
- Presenting data to stakeholders to take action.
- Re-evaluating data or outcomes.
- Following-up on implementation of actions agreed upon/required.
Activity: Defining Features Matrix
Now that you have a better understanding of assessment and evaluation, complete the defining features matrix. Categorize the concepts assessment and evaluation according to the presence (+) or absence (-) of the important defining features listed below.
| Features | Assessment | Evaluation |
|---|---|---|
| Requires on-going activity | ||
| Require criteria to make decisions | ||
| Provides closure | ||
| Aims to improve the quality of higher education | ||
| Uses data measurement | ||
| Aims to judge the quality of higher education | ||
| Highlights shortfalls from the data | ||
| Is evidence-based | ||
| Can be individualized |
Features of Assessment – Answers
Implementing Assessment for Evaluation
Good assessment is not a ‘one-and-done’ project. Assessment is an ongoing systematic effort to improve the quality of education. Systematic does not necessarily mean doing the exact same thing every year, however. You cannot conduct assessment the exact same way every time because needs, students, tools, and curricula are always changing. Systematic really refers to having an approach or a plan to assessment that you are working towards continuously. Many of these elements are associated with information in the other assessment modules and are linked below. Here is one example of a systematic approach to assessment adapted from Banta and Palomba (2015):
I. Planning
- Engage stakeholders.
- Identify the purpose of the assessment.
- Create a written plan with milestones over several years for sustainability.
II. Implementation
- Identify leadership at all levels (course, department, program, institutional).
- Identify data collection strategies.
- Develop or purchase appropriate measurement instruments.
- Orient stakeholders to the tools and their role.
- Collect Data.
- Organize and analyze data.
- Summarize findings.
- Share results.
III. Improving and Sustaining
- Evaluate credibility of evidence (performed by stakeholders).
- Improve collection methods, if necessary.
- Review, share, and take necessary actions related to assessment findings (performed by assessment leadership).
- Reexamine assessment plan and processes periodically, and make changes as necessary.
Activity: Reviewing Your Systematic Approach
Using Banta and Palomba’s (2015) example, think about assessment on your campus. Check off the steps that you know are currently happening. Which steps are you missing? Are there additional steps in your process that are not listed here?
Planning
- Engage stakeholders.
- Identify the purpose of the assessment.
- Create a written plan with milestones over several years for sustainability.
Implementation
- Identify leadership at all levels (course, department, program, institutional).
- Identify data collection strategies.
- Develop or purchase appropriate measurement instruments.
- Orient stakeholders to the tools and their role.
- Collect data.
- Organize and analyze data.
- Summarize findings.
- Share results.
Improving and Sustaining
- Evaluate credibility of evidence (performed by stakeholders).
- Improve collection methods, if necessary.
- Review, share, and take necessary actions related assessment findings (performed by assessment leadership).
- Reexamine assessment plan and processes periodically, and make changes as necessary.
Final Reflection
Now that you understand the differences between assessment and evaluation and the tasks involved, how well does your organization score?
Assessment
- Exceeds expectations
- Meets expectations
- Needs improvement
Evaluation
- Exceeds expectations
- Meets expectations
- Needs improvement
If you checked ‘needs improvement’, what tasks need to be addressed? Who can help facilitate this change?
| Task to Address | Who can help with this? |
|---|---|
Resources
Banta, T. W., & Palomba, C. A. (2015). Assessment essentials: Planning, implementing, and improving assessment in higher education. San Francisco, CA: Jossey-Bass.
Suskie, L. (2009). Assessing student learning: A common sense guide. (2nd. ed.). San Francisco, CA: Jossey-Bass.
Chapter 3: What basic assessment terminology do I need to know?
Warm Up Activity
Write as many assessment terms as you can in 30 seconds.
Now, with your list of terminology, circle the terms you can confidently define.
Were you able to circle every item? Did you have terms listed that you consistently hear or say but are unable to clearly define? We will cover several common terms in this module.
Are You Confused by Assessment Jargon?
The assessment process can be confusing but the terminology can be even more so. Are you confused by assessment jargon? Is there an assessment term you hear all the time but are unsure exactly what it means?
Here is a list of commonly used assessment terms you should know. There may be several different ways to define the same term–these definitions are what we found in popular literature. While the following definitions are widely accepted it will be important for you to understand and use the terminology as it is defined on your own campus. Consistency is key to assessment!
This is a glossary for your reference. Feel free to scan these terms and definitions as needed.
Activity: Important Terminology in Use
As stated previously, terms may mean different things at different institutions. You can help your assessment efforts by establishing a consistent language around assessment terminology. Think about the terms you just reviewed. Determine which ones you can use as is, which ones need clarification based on your institution’s definition and use, and which terms are missing. You may want to work with a colleague to brainstorm.
Final Reflection
After completing the activities, answer the following questions. You can do this exercise through either individual reflective writing or discussion with a partner.
- How many words/expressions do you think you have acquired?
- Do you think you will be able to understand the meanings when you hear them in a conversation?
- Do you think you will be able to understand the meanings when encountering them in readings?
- Have you used them in speaking or writing?
- What are some strategies you can employ to help you remember important terms at your institution?
Resources
Angelo, T. A., & Cross, K. P. (1994). Classroom assessment techniques. San Francisco, CA: Jossey-Bass.
Banta, T. W., & Palomba, C. A. (2015). Assessment essentials: Planning, implementing, and improving assessment in higher education. San Francisco, CA: Jossey-Bass.
Leskes, A. (Winter/Spring 2002). Beyond confusion: An assessment glossary. Peer Review, Washington, DC: AAC&U.
Maki, P. L. (2010). Assessing for learning: Building a sustainable commitment across the institution. (2nd ed.). Sterling, VA: Stylus.
Palomba, C. A., & Banta, T. W. (1999). Assessment essentials: Planning, implementing, and improving assessment in higher education. Higher and Adult Education Series. San Francisco, CA: Jossey-Bass.
Secolsky, C., & Denison, D. B. (Eds.). (2012). Handbook on measurement, assessment, and evaluation in higher education. New York, NY: Routledge.
Suskie, L. (2009). Assessing student learning: A common sense guide (2nd ed.). San Francisco, CA: Jossey-Bass.
Chapter 4: What frameworks will help me understand assessment in higher education?
Warm Up Activity
What are some of the methods that you use to collect evidence that students are meeting your course, program, and/or institutional learning objectives? Use the table below to identify the methods used by you and your colleagues on your campus to assess student learning.
| Assessment Methods | Course Assessment | Program Assessment | Institutional Assessment |
|---|---|---|---|
| Tests & Quizzes | |||
| Focus Groups | |||
| NCLEX or other licensure exams | |||
| Senior Capstone Portfolio | |||
| Offer of Employment | |||
| Oral Presentation | |||
| Polling |
What frameworks will help me understand assessment in higher education?
“To be meaningful, assessment should provide both students and faculty with information for improvement at both course and program levels” (Palomba & Banta, 1999, p. 69).
Assessment is a process that focuses on student learning in a systematic way and is done on many levels. To find out if students are learning:
- we collect evidence;
- reflect on what the evidence tells us about student learning; and
- review and revise our approaches to teaching and learning when the evidence suggests that students are not learning as we intended.
Data are collected for multiple reasons
Formative and summative assessments can be applied at both the course and program level. At the program level, Palomba and Banta (1999) suggest that we may use assessment data to form the structure of the program. Once the program is formed, we assess data in a summative way to test the effectiveness of the program.
At the course level, formative assessments are built around smaller increments of learning objectives and summative assessments are meant to test how well students met the learning objective as a whole.
Formative assessment happens during the learning process and is described by Bailey & Jakicic (2012) as “an activity designed to give meaningful feedback to students and teachers and to improve professional practice and student achievement” ( p. 14).
Summative assessment occurs at the end of the learning process and “is used to give a grade or provide a final measure of students results” (Bailey & Jakicic, p. 14).
Activity: Formative or Summative
In the chart below, determine whether the assessment is formative or summative and describe its purpose.
| Assessment Activity | Formative/Summative | Purpose |
|---|---|---|
| Clicker (student response systems) | Formative | To give immediate feedback |
| Quizzes | ||
| Presentations | ||
| Concept Maps | ||
| Practice Problems | ||
| Exams | ||
| Discussions | ||
| Self-assessments |
Data are collected using multiple methods
The following overview of assessment methods is not meant to be exhaustive; rather, it is an introduction to some of the most well known and practiced methods of collecting evidence of learning. Institution, program, and course assessors are encouraged to survey stakeholders and expand upon these methods in ways that meet the learning needs of individual institutions.
Direct and Indirect Methods of Assessment
A meaningful assessment plan includes both direct and indirect methods of assessment. While these terms may look like a dichotomy, it may be more useful to think of the relationship between direct and indirect measures as a continuum. To read more about this line of reasoning, please see Analysis Methods.
Direct methods of assessment are generally thought to be quantitative in nature, while indirect methods are more often thought of as qualitative. In terms of data collection, they complement one another.
- Direct Methods of collecting assessment data “require students to display their knowledge and skills as they respond to the instrument itself” (Palomba & Banta, 1999, p. 11). When you ask students to respond to questions on an exam, you are using the direct method of assessment.
- Indirect Methods of collecting assessment data can be “helpful in deepening interpretations of student learning” (Maki, 2010, p. 213). When you ask students to respond to a survey or participate in a focus group, you are using the indirect method of assessment.
Examples:
Direct Methods of Assessment:
- True/False Test
- Graded Clicker Questions
- Pass Rates on Licensure Exams
Indirect Methods of Assessment:
- Graduation Rates
- Small Group Instructional Diagnosis (SGIDs)
- Interviews
Activity
Direct Methods of Assessment offer evidence by way of actual student work of what students are or are not learning.
Indirect Methods of Assessment is more of an interpretation of what students are or are not learning.
Using the definitions above, try your hand at distinguishing between the direct and indirect methods of collecting assessment data. Can you add some of your own?
| Activity | Direct | Indirect |
|---|---|---|
| Results of a practice CPA exam | ||
| Offer of employment to a graduate of your program | ||
| Holistically scored writing sample using a rubric | ||
| Admission rates of graduates to graduate school | ||
| Community College Survey of Student Engagement (CCSSE) | ||
| Results of NCLEX Examination | ||
| Final Art Portfolio for Senior Capstone |
Quantitative vs Qualitative Approaches to Assessment
Palomba and Banta (1999) note that a number of authors agree that the use of qualitative information is increasingly being used to assess academic programs. In her words, the differences between qualitative and quantitative methods are:
“Quantitative methods are distinguished by their emphasis on numbers, measurement, experimental design, and statistical analysis . . . . in contrast, qualitative methods such as in-depth, open-ended interviews, observations of activities, behaviors, and interactions, and analysis of written documents yield direct quotations, descriptions, and excerpts other than numbers” (p. 337).
While there is a distinction between quantitative and qualitative assessment methods, there is no one size fits all. Certain disciplines, such as pharmacology and engineering, may have an agreed upon body of knowledge that is assessed differently than the liberal arts; however, many disciplines would benefit from a combination of these methods in order to bring a balance to the process of assessment.
Activity: Quantitative and Qualitative
Quantitative Methods of Assessment offer statistical results.
Qualitative Methods of Assessment offer descriptive results.
Reflect upon what assessment activities you are doing that is formative/summative, direct/indirect and qualitative/quantitative.
 Objective and Subjective Assessments
A well constructed objective assessment that has been tested for reliability and validity is generally easy to administer and can be completed by the student in a relatively certain amount of time. Examples include tests using the following types of formats:
- Multiple-choice test questions
- True-false test questions
- Matching test questions
Subjective assessments are used to evaluate skills that cannot easily be assessed using objective tests. For example, subjective tests may be used to assess critical thinking, summarizing, synthesis, and creativity skills.
 Activity: Objective and Subjective
Objective Methods of Assessment typically offer one correct answer.
Subjective Methods of Assessment offer an opportunity for more than one supported answer.
There are many examples of assessments that combine both objective and subjective assessment questions. For example, on a mathematics assessment, one can pose problems to be solved and ask the students to explain how they went about solving the problem. Can you think of an example of an assessment that would benefit from both objective and subjective questions leading to data that would help you assess your course or program?
Final Reflection
Now that you have had a chance to learn more about assessment frameworks, consider how the frameworks can be applied to your own assessment efforts. Using the provided table, compile a list of assessment activities you currently use for collecting assessment evidence. When you have completed the first list, create a second list of assessment activities that you would like to use in the future.
Current Assessment Activities
| Formative Activities | Summative Activities | Objective or Subjective | Qualitative or Quantitative |
|---|---|---|---|
Future Assessment Activities
| Formative Activities | Summative Activities | Objective or Subjective | Qualitative or Quantitative |
|---|---|---|---|
Resources
Banta, T. W., & Palomba, C. A. (2015). Assessment essentials: Planning, implementing, and improving assessment in higher education. New York, NY: John Wiley & Sons.
Bailey, K., & Jakicic, C. (2012). Common formative assessment: A toolkit for professional learning communities at work. Bloomington, IN: Solution Free Press.
Maki, P. L. (2010). Assessing for learning: Building a sustainable commitment across the institution. Sterling, VA: Stylus
Conclusion and resources
Summary of Key Points
- Assessment terminology is used interchangeably at different institutions and across accrediting agencies
- Assessment language should be used consistently within your own institution
- Assessment is not new; it is something that everyone already does
- Assessment is the connection between outcomes and the intended goals and objectives of learning
- Assessment results often link to changes in programs and course design
- Careful planning goes into the gathering of assessment data
- Assessment activities can be useful as stand-alone activities; the evaluation of assessment data can be used to make change
- ‘Good’ assessment is an ongoing, systematic effort to improve the quality of education
- Assessment data is collected through multiple approaches and for multiple reasons
Reflection
- What are some assessment activities that you are currently not doing that you should be?
- What assessment activities are you already doing that you did not realize?
- How well are the terms assessment and evaluation understood at your institution?
- Does your institution have an approach or plan for assessment? If not, what actions can you take to begin a conversation about establishing an assessment plan?
- Why is it important for your institution to use and understand assessment terminology in the same way? What could go wrong if you are not?
- With a basic understanding of assessment terminology, where might someone begin looking for data? (hint: it is the foundation for designing courses, programs, etc.)
- Why is it important to understand the differences between formative and summative assessment; indirect and direct; qualitative and quantitative; objective and subjective?
- What data might you need for assessment? How would you go about gathering it?
Module Assessment: Demystifying Assessment
Assessment Activity
Cited & Additional Resources
Angelo, T. A., & Cross, K. P. (1994). Classroom assessment techniques. San Francisco, CA: Jossey-Bass.
Banta, T. W., & Palomba, C. A. (2015). Assessment essentials: Planning, implementing, and improving assessment in higher education. San Francisco, CA: Jossey-Bass.
Leskes, A. (Winter/Spring 2002). Beyond confusion: An assessment glossary. Peer Review, Washington, D.C.: AAC&U.
Maki, P. L. (2010). Assessing for learning: Building a sustainable commitment across the institution. Sterling, VA: Stylus.
Maxfield, L. (2010). Assessment is like a box of chocolates. In P. L. Maki (Ed.), Coming to terms with student outcomes assessment: Faculty and administrators’ journeys to integrating assessment in their work and institutional culture. Sterling, VA: Stylus.
Perrine, R., Sweet, C., Blythe, H., Kopacz, P., Combs, D., Bennett, O., Street, S., & Keeley, E. (2010). The transformation of a regional comprehensive university. In P. L. Maki (Ed.), Coming to terms with student outcomes assessment: Faculty and administrators’ journeys to integrating assessment in their work and institutional culture. Sterling, VA: Stylus.
Palomba, C. A., & Banta, T. W. (1999). Assessment essentials: Planning, implementing, and improving assessment in higher education. San Francisco, CA: Jossey-Bass.
Secolsky, C., & Denison, D. B. (Eds.). (2012). Handbook on measurement, assessment, and evaluation in higher education. New York, NY: Routledge.
Suskie, L. (2009). Assessing student learning: A common sense guide. San Francisco, CA: Jossey-Bass.
Walvoord, B. (2004). Assessment clear and simple. San Francisco, CA: Jossey-Bass.
Introduction
*Please note: some of the terminology included in this module are used interchangeably at different institutions and across accrediting agencies; we indicate this where possible.
Goals and Objectives Facilitation Guide
LARC Beta-Testing Institutional Example 1
LARC Beta-Testing Institutional Example 2
LARC Beta-Testing Institutional Example 3
LARC Beta-Testing Institutional Example 4
Intended Audience
This module is a process-oriented guide to writing goals, outcomes, and objectives. It is intended for:
- Faculty at all levels who are engaged in course and program design; and/or
- Staff and administrators who are creating curriculum, programs, or initiatives.
Goals
This module is designed to help participants:
- Recognize the difference between goals, outcomes, and objectives.
- Understand benefits of clear and aligned goals, outcomes, and objectives.
- Identify the relationship between goals, outcomes, and objectives at the course, program, and institution levels.
- Practice the process of drafting, reviewing, and revising goals, outcomes, and objectives.
- Identify varied terminology associated with goals, outcomes, and objectives in relation to your own institutional context.
Objectives
Upon completion of this module, participants will be able to:
- Define the term ‘learning goal’.
- Define the term ‘learning objective’.
- Differentiate between goals and objectives.
- Articulate the relationship between goals and objectives.
- State the benefits of utilizing goals and objectives to structure a course, program, or institution-level initiative.
- Align goals and objectives at the course, program, and institution level.
- Identify the steps needed to draft effective goals and objectives.
- Draft a goal.
- Draft an objective.
- Recognize effective goals and objectives.
- Scale goals and objectives up or down as needed for course or program-level curriculum.
Chapter 1: How are goals and objectives defined?
Warm Up Activity
How does your institution define goals and objectives? Is the terminology consistent across schools and programs?
Take out a piece of paper and draw an image that best represents your definition and the relationship between goals and objectives. Label the image as needed.
How Do We Articulate Goals and Objectives?
What does the literature say about assessment terminology?
Assessment terminology has been somewhat inconsistent both in the assessment literature and across institutions of higher education. The terminology may depend on your institution’s approach to measuring student learning:
- mission/goals
- learning outcomes/learning objectives
- instructional outcomes/instructional objectives
- educational outcomes/educational objectives
Why is there such variation? Over the years there has been a shift in approaches to learning:
Objectives-based –> Competency-based –> Outcomes-based
What is your institutional approach to education? Keep your answer in mind as you begin to articulate your goals and objectives.
While this variation in the language may be due to a lack of consensus, it does not diminish the importance of articulating your institutional assessment plan using a model that illustrates the connections between the mission of the university all the way down to the instructional outcomes of a learning unit. We refer to this as alignment.
Why we chose to use the terms goals and objectives:
Barbara Walvoord (2010) suggests that the choice of the term you choose be intentional and broad enough to be “stated at various levels of generality” (p. 14) with the caveat that “if your accreditor, board, or system is using any of these terms with a specific meaning, good communication practice would suggest that you use their terms when you write for them” (p. 14).
Linda Suskie (2009) broadly describes learning outcomes or learning goals as “goals that describe how students will be different because of a learning experience” (p. 117). She suggests that “objectives describe detailed aspects of goals,” and “the tasks to be accomplished to achieve the goal” (p. 117).
With Walvoord’s and Suskie’s statements of intentionality in mind, we chose to use the terms as illustrated in the Inverted Pyramid.
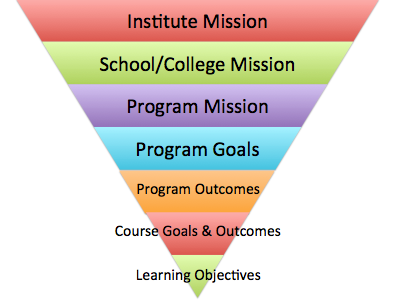
Activity: What is Your Institutional Hierarchy?
This inverted pyramid is meant to convey an institution’s hierarchical alignment (a connection/relationship) between statements of intentionality; its broad mission and goals with program and course goals and outcomes and specific learning objectives.
Considering your own institutional context, decide which terms are most appropriate in your hierarchal structure and add them to the blank inverted pyramid in the Institutional Alignment Handout (Word doc).
Using the terms in your hierarchical structure – goals, objectives, outcomes, etc., how would you describe the hierarchy for your college or university?
Question:
Now that you have identified your institutional hierarchy, consider how your institutional goals align with the institutional mission. Can you articulate the relationship?
Final Reflection
Reflect on the following questions while considering your own institution. You can do this exercise through either individual reflective writing or discussion with a partner.
- What terminology do you use?
- Does the terminology vary across school or department?
- Do you understand the rationale for the choices being made with respect to the terms being used?
Resources
Covey, S. R. (2004). The 7 habits of highly effective people: Restoring the character ethic ([Rev. ed.].). New York, NY: Free Press.
Suskie, L. (2009). Assessing student learning: A common sense guide. San Francisco, CA: Jossey-Bass.
Walvoord, B. E. (2010). Assessment clear and simple: A practical guide for institutions, departments, and general education. Hoboken, NJ: John Wiley & Sons.
Chapter 2: What are goals and objectives?
Warm Up Activity: The “Big” Picture
“To begin with the end in mind means to start with a clear understanding of your destination. It means to know where you’re going so that you better understand where you are now so that the steps you take are always in the right direction.”
-Steven Covey, The Seven Habits of Highly Effective People
In the backwards design of a course, we start with desired results, goals, and what we want our students to learn or become. Writing course goals and objectives is the key initial step in what is referred to as ‘backward design’ (Wiggins & McTighe, 2004).
Similarly, backward design can be used in assessment. “Planning the assessment process backward before initiating it slows us down to think not only about what we want to assess, but also whom we want to assess, how we want to assess, and when we want to derive evidence of students’ enduring learning along their educational journey,” writes Peggy Maki in Assessing for Learning: Building a Sustainable Commitment Across the Institution.
To slow us down, it is helpful to begin with the ‘big picture;’ that is, to decide what you want your students to be able to do (in a broad sense) upon graduation from your institution, your program or at the completion of your course. Begin by considering your broad goals. What is it you want your students to remember long after they leave you institution, your program, or your course?
Here are some examples of broad goals to assist in your thinking:
- Students will learn how to consistently and skillfully use critical thinking to comprehend the world and reason about situations, issues, and problems they confront.
- Students will learn how to reason and act in a consistently ethical fashion with respect to other people, animals, and the natural environment.
- Students will learn how to use concepts and principles of ecology, together with plausible evidence, to describe the interactions of organisms with their environments and with each other.
- Students will learn how to become involved and act responsibly and with informed awareness of contemporary issues in a community and to develop leadership abilities.
- This course is intended to equip students with skills needed to locate, gather, and use information intellectually and responsibly.
- By the end of this course, the successful student will understand the scientific method.
- By the end of this course, the successful student will understand that societal institutions are sites of power, organized and operated via the intersections of race, class, gender, sexual orientation, immigration status, abilities, etc.
- The successful student in this course will be able to argue as a professional historian does.
- The successful student will understand the complexities of trade networks and the interactions it engenders.
- The successful student will understand how a region’s topography, climate, and natural resources influence its inhabitants’ cultures, economy, and lifestyles.
- The successful student will learn the difference between physical change and chemical change in a substance.
- The successful student will understand the important contributions that statistical analysis can make to understanding.
Directions:
Take a moment to reflect on the importance of looking at the ‘big picture’ before focusing on the details. Consider the following questions:
- Have you, when planning any event, focused on the details before considering the big picture? What hurdles did this approach present?
- Starting with the big picture, what do you want your students to remember about your institution, your program, or your course upon completion?
What are Institutional Goals?
Institutional goals may be found within the broad mission statement of the college or university and offered as the institution-wide vision. Within the mission statement or vision, you may find embedded learning goals. In some cases, Walvoord (2010) suggests that institutions with very different schools (Medical and Law Schools) and a very broad mission for the institution may benefit from “constructing a meaningful set of learning goals for each distinct college or campus because these goals can be specific enough to guide assessment and action” (p 28).
You will likely find your institutional goals with or in close proximity to your institutional mission and vision statements.
What if your mission statement is not stated as learning goals? Walvoord (2010) suggests considering accreditors’ guidelines. Regional accrediting agencies such as the New England Association of Schools and Colleges (NEASC) offer specific student learning goals. Standard 4.2 reads: “The institution publishes the learning goals and requirements for each program. Such goals include the knowledge, intellectual and academic skills, competencies, and methods of inquiry to be acquired. In addition, if relevant to the program, goals include creative abilities and values to be developed and specific career-preparation practices to be mastered.”
The Association of American Colleges and Universities has a set of “essential learning outcomes,” and a number of colleges and universities post their institutional goals online:
Activity: Your Institutional Goals
Considering your own institutional context, review your institutional mission and vision statements. Does your institution have goals or competencies defined and published? If not, can you use your institutional mission to state the goals? Record your institutional goals and/or competencies in the Institutional Alignment Handout (Word doc).
 How does your program align with the institutional goals?
What are Program Goals?
When you completed the ‘Big Picture’ activity, you were asked to think about what you would like your students to remember about what they have learned from your institution, your program, or your course upon completion.
Program Mission
A Program Mission is a holistic view of the general values and philosophy of an educational program. Program goals, on the other hand, are stated as overarching, intended outcomes of the program. They may be embedded within the Program Mission or they may be clearly stated as stand-alone goals. While the Program Mission and the Program Goals are not measurable, they should be aligned with the institutional mission. (Refer to your inverted pyramid.)
Questions
- Do you have a Program Mission?
- Is it aligned with your Institutional Mission and Goals?
Program Goals are
- Aligned with institutional and program mission/goals/competencies.
- Broadly stated and therefore cannot be directly measured.
- Important for establishing learning objectives for a program/department.
Program objectives are then used to assess the effectiveness of a program/department/project. For faculty, it is important to understand program goals so that courses are appropriately aligned with program objectives.
Program/Department Goal Examples from various programs:
Upon completion of the program, students will:
- Understand how technology can be used to solve real business problems.
- Understand the critical components of an effective oral presentation.
- Understand the ethical dimension of environmental problems.
- Learn about the process of identifying real-world ethical problems.
- Understand the regulatory and professional standards and pronouncements relevant to their degree program and be able to apply that authoritative guidance appropriately in specific contexts.
- Demonstrate the extension and appreciation of the skills and knowledge acquired during their communication studies in their careers beyond the university or in the continuation of their education.
- Develop a critical understanding of a significant portion of the field of psychology.
Accrediting agencies (program level)
Walvoord (2010) reminds us that “regional accreditors will want to see written goals at the level of the institution, general education, and department or program” (p. 31). The AACSB (American Assembly of Collegiate Schools of Business) uses a goal-based model “as a condition of accreditation” (Palomba & Banta, 1999, p 301). In addition, the American Speech-Language-Hearing Association and the National Council for Accreditation of Teacher Education (NCATE) also focus on expected outcomes and continuous improvement of associated programs (Palomba & Banta 1999).
Activity: Find Your Program Goals
Revisit the Institutional Alignment Handout (Word doc). Fill in the Program Goals section on your inverted pyramid with your program goals.
 Questions:
As you fill in the pyramid with your program goals, consider these questions:
- Can these statements be rewritten as intended goals for your program graduates?
- Are these statements in alignment with your institutional and program missions?
- Can you start each of your statements with “upon completion of this program, students will understand (or know)”?
If you answered yes to all of the above, you are on your way to articulating your intended goals. If not, edit the statements, as needed.
What are Program Outcomes?
Now that you have a better understanding of the terminology ‘goal,’ ‘outcome,’ and ‘learning objective,’ let’s return back to our inverted pyramid. While ‘Program Outcome’ is listed higher in the inverted pyramid – because these outcomes are at the program level – the definition of ‘outcome’ is similar to ‘objectives’, as you were able to see in the previous section.
Program outcomes are a product of the program goals. These stated outcomes are observable and measurable, like learning objectives, and should directly align with the program goals.
Program outcomes describe the achieved results or consequences of what students learned in the program, and because the program is “integrated and greater than the sum of its parts” (Suskie, p. 7), they can be embedded in a number of learning experiences other than traditional courses (capstone experiences, field experiences, for example). Outcome statements answer the question: what can students do as a result of what was learned providing evidence that they have met the particular learning goal?
Learning outcomes are statements that indicate what students will know, value or be able to do (KSAs: knowledge, skills, abilities and/or attitudes).
Program outcomes
- align with program goals.
- refer to the achieved result of learning rather than the process of learning.
- are important for assessing effectiveness of the program.
Activity: Find Your Program Outcomes
Revisit the Institutional Alignment Handout (Word doc). Fill in the pyramid with your program outcomes.
Question: Are the program outcomes in alignment with your institutional and program missions, and your program goals?
What are Course Goals and Outcomes?
While course goals and outcomes may be situated at the same hierarchical level as shown in our inverted pyramid, they describe two different results.
Course goals are stated in broad, general terms. They encompass several subordinate skills which are further identified and clarified in measurable learning objectives. While course goals are not directly measurable, they should be aligned with program goals and outcomes. (Refer to your inverted pyramid.)
Course goals:
- Align with program goals, outcomes, and course learning objectives.
- Broadly stated and, therefore, cannot be directly measured.
- Help establish learning objectives.
Examples of course goals
Upon successful completion of this course, students will:
- Understand the historical development of evolutionary natural philosophy and science.
- Know how to construct and give constructive feedback.
- Understand how to use concepts and principles of ecology, together with plausible evidence, in order to describe the interactions of organisms with their environments and with each other.
Course outcomes are defined similarly to program outcomes. They are different in that they are situated at the course level rather than the program level.
Course outcomes:
- Align with course goals.
- Refer to the achieved result of learning rather than the process of learning.
- Are important for assessing effectiveness of the course.
Activity: Find Your Course Goals and Outcomes
Revisit the Institutional Alignment Handout (Word doc). Fill in the course goals section on your inverted pyramid.
Questions:
- Are the course goals in alignment with your institutional and program missions, your program goals, and program objectives/outcomes?
- Are the course outcomes in alignment with your course goals?
What are Learning Objectives?
As stated previously, course goals are stated in broad, general terms. They encompass several subordinate skills which are further identified and clarified in measurable learning objectives. Outcomes describe the achieved results or consequences of what was learned – whether that be at the program or course level.
Learning objectives, on the other hand, describe what students will do as a result of the teaching and learning activities. Learning objectives answer the question: what is it you want your students to be able to do as a result of the course activities that will provide evidence that they have met the particular learning goal?
In turn, learning objectives are used to assess individual student learning. For faculty, it is important to understand the stated course goals so that the learning objectives are designed to help students meet the course goals. This is commonly referred to as alignment.
Examples of learning objectives
Upon successful completion of this course, students will:
- Analyze the nutritional value of given meal.
- Construct an argument supporting the use of daily vitamins.
- Assess a 2-day dietary intake and interpret the results.
You should check with your institution to learn how this terminology is being defined and used on your campus. We are reminded by Maki (2012) that the terms learning outcome statements, learning objectives, or educational objectives are many times used interchangeably (p. 89). Both learning objectives and learning outcome statements must be stated in observable and measurable terms; they cannot be activities that are internal to students’ minds (Do not use the following examples: think, appreciate, understand, internalize, know, etc.).
Activity: Find Your Learning Objectives
Self-Assessment Activity
Final Reflection
Defining, revising, and revisiting goals and objectives can be very powerful. Write a short paragraph reflecting on your journey to better understanding goals and objectives. Consider the following questions:
- Did you find it difficult to clearly articulate goals and objectives?
- Was it difficult to understand the differences between goals and objectives?
- How can you share the information you have learned today to better improve assessment processes?
Resources
Maki, P. L. (2012). Assessing for learning: Building a sustainable commitment across the institution. Sterling, VA: Stylus Publishing.
Palomba, C. A., & Banta, T. W. (1999). Assessment essentials: Planning, implementing, and improving assessment in higher education. San Francisco, CA: Jossey-Bass.
Suskie, L. (2009). Assessing student learning: A common sense guide. San Francisco, CA: Jossey-Bass.
Walvoord, B. E. (2010). Assessment clear and simple: A practical guide for institutions, departments, and general education. San Francisco, CA: Jossey-Bass.
Wiggins, G., & McTighe, J. (2004). Understanding by Design. Alexandria, VA: Association for Supervision and Curriculum Development.
Chapter 3: What are the benefits of having course goals, outcomes, and learning objectives?
Warm Up Activity
Write as many benefits to having defined course goals and outcomes and learning objectives as you can think of in 30 seconds.
Were you able to come up with more than five? Are these benefits things you have experienced or just read about?
Watch the video of multiple stakeholders sharing their thoughts on the benefits of defining goals and learning outcomes to improve teaching and learning in each of their respective roles. After listening to their experiences, reflect on the content by answering the questions in the activity section below.
Activity: Reflecting on Shared Experiences
After watching the video discuss with colleagues the following questions:
- What were some of the key themes that you heard/saw in the videos?
- Which benefits on your list were also mentioned by the faculty and administrators in the video?
- Which benefits mentioned in your video were not on your initial list? Did these benefits surprise you? If so, why?
- What differences did you notice in how the different types of positions (director of assessment, chair, and faculty member) communicated benefits from goals and learning outcomes? How did they use outcomes similarly or differently?
If you have generated additional ideas after watching and reflecting on the video, please add them to your initial list from the warm up exercise.
Differences Between Goals, Outcomes, and Learning Objectives
In addition to where you are situated in the hierarchical pyramid (institute level, program level, course level, etc.), it is also important to understand the differences between the terms ‘goals’, ‘outcomes’, and ‘learning objectives’. Goals are typically defined as a broad statement and outcomes and learning objectives are defined more narrowly, which enables assessment.
While broad terms are acceptable for goal statements, they are not measurable. (This is why outcomes and learning objectives are so important for assessment). Here are some words and phrases that are broad and not measurable and observable. While they are completely acceptable for goals, they should be avoided in outcome statements and learning objectives:
- Understand
- Appreciate
- Comprehend
- Grasp
- Know
- Accept
- Know
- Greater appreciation for
- Have knowledge of
- Be aware of
- Be conscious of
- Learn
- Learn to understand
- Perceive
- Value
- Get
- Internalize
- Be familiar with
Outcomes and learning objectives are stated as achievable, observable, measurable statements. Each should begin with an action verb. Using action verbs will typically narrow the focus of the statement. A great resource to use to find inspiration for action verbs, while considering different cognitive levels and knowledge dimensions is Bloom’s Taxonomy. You may find this document from the Center for Excellence in Learning and Teaching at Iowa State University helpful.
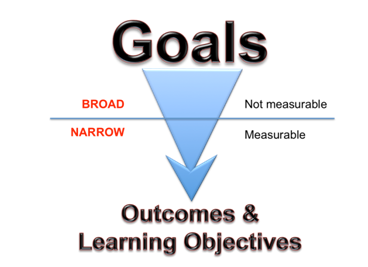
Sometimes the terms are used interchangeably. Other times they are defined differently across schools and departments. It is very important that you have a solid understanding of what the terms represent at your institution and in your department. How they are defined in one department may look very different in another school or department.
As we move deeper into assessment of learning, it may be helpful to see a direct comparison of goals, outcome statements, and learning objectives. Here is an image representing how we define goals, outcomes, and learning objectives.
| Goals | Outcomes | Learning Objectives |
|---|---|---|
| Broad | Narrow | Narrow |
| General Intentions | Specific, achieved results | Specific, achieved results |
| Intangible | Tangible | Tangible |
| Generally, difficult to measure | Measurable | Measurable |
| Consequences of instruction or activities | Consequences of what was learned | Consequences of instruction or activities |
Activity: Is This Statement Broad or Narrow
Self Assessment Activity
Research on the Benefits of Learning Objectives/Outcomes
Why is this so important?
Walvoord (2010) points out, the mere act of assessment is not what improves student learning. It is the action taken based on the decisions made resulting from assessment that can improve student learning. Assessment gives us several ways to gather, interpret, and use data to provide information we need to take appropriate action (2010). Learning objectives/outcomes are an important, foundational component in this process.
Defining goals and learning outcomes are important in understanding what you want students to be able to “represent, demonstrate, or produce based on how and what they have learned” (p. 87, Maki, 2012). Diamond (2011) purports clearly stated outcomes are one of the six factors common in successful academic programs and establishing goals and outcomes is the first step in assessment. Establishing clear outcomes is beneficial for several reasons:
- Better Learning and Increased Motivation: Learning outcomes provide guidance for instructional design and communicate to students what is expected of them (Huba and Freed, 2000). Sharing expectations, in fact, has been said to improve student motivation and engagement (Barkley, 2010).
- Better Student Performance: When clear expectation are set by defining learning outcomes students spend less time trying to figure out what an instructor wants and what they need to accomplish. They are able to focus their learning and achieve better results.
- Focused Strategy for Teaching and Assessment: Clearly stated learning objectives/outcomes are an important foundation in Backwards Design, an instructional design model where curricula and courses are designed by first defining where you want your students to end up (outcomes). Working ‘backwards’, assessments are designed to measure successful achievement of the stated outcomes and learning activities/strategies are designed to support students’ learning to successfully complete the assessments. Alignment across objectives/outcomes, activities, and assessments is key.
- Focus is on Learning – the End Result: Last, for assessment to work, data collectors must be purposeful in what they are going to collect and be able to pinpoint data in the curriculum. As a foundation for assessment, clear and measurable learning outcomes are necessary. Alignment across outcomes, activities, and assessments ensures the assessments created will measure what students have (and have not) learned, and therefore the data collected to make decisions is valid and reliable.
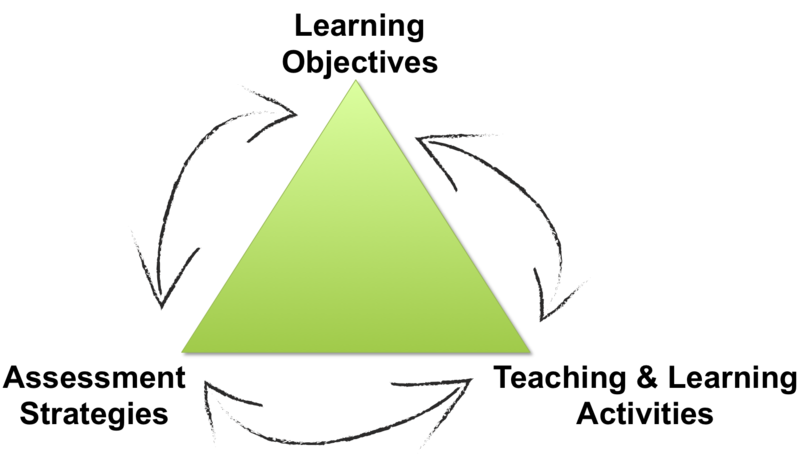
Activity: How Learning Objectives/Outcomes Benefit Different Roles
Who Benefits?
Learning objectives/outcomes are beneficial at several levels to many different people. How would learning objectives benefit faculty/department chairs/administration at the course/program/institutional level?
To begin, pick three cells where different levels intersect with different audiences. In each cell chosen, brainstorm what benefits are realized by utilizing learning objectives/outcomes to structure a course, program, or institution-level initiative. Record your answers in the appropriate cells in the Learning Objectives Matrix.
Next, cross-check your matrix with some of our thoughts in the sample provided.
What similarities do you see?
- What differences do you see?
- How has this exercise made you think differently about learning objectives/outcomes?
Final Reflection
Return to your Warm Up Activity page where you recorded ‘benefits’ to learning objectives. Now that you have spent more time thinking about how learning objectives can improve assessment, what are some additional realizations?
Name one action you can do to facilitate and/or improve the development and implementation of learning objectives.
Resources
Barkley, E. F. (2010). Student engagement techniques: A handbook for college faculty. Hoboken, NJ: John Wiley & Sons.
Diamond, R. M. (2011). Designing and assessing courses and curricula: A practical guide. Hoboken, NJ: John Wiley & Sons.
Huba, M. E., & Freed, J. E. (2000). Learner centered assessment on college campuses: Shifting the focus from teaching to learning. Community College Journal of Research and Practice, 24(9), 759-766.
Maki, P. L. (2012). Assessing for learning: Building a sustainable commitment across the institution. Sterling, VA: Stylus Publishing, LLC.
Suskie, L. (2010). Assessing student learning: A common sense guide. Hoboken, NJ: John Wiley & Sons.
Walvoord, B. E. (2010). Assessment clear and simple: A practical guide for institutions, departments, and general education. Hoboken, NJ: John Wiley & Sons.
Chapter 4: How are goals and learning objectives created?
Warm Up Activity
Do you remember how to tell the difference between a goal and an objective? There are clear differences and it is very important to understand this before you begin writing. Take a minute to review this table and compare your goals and objectives.
Do you notice any discrepancies? Do you need to re-work some of your learning objectives? Do the learning objectives clearly connect with at least one goal? Don’t worry if you need to make some adjustments but are unclear how. We will walk through the necessary steps during this module.
| Characteristic | Course Goals | Learning Objectives |
|---|---|---|
| Measurable and observable | X | |
| Student-centered rather than course-centered | X | X |
| Reflect what you want your students to be able to DO | X | |
| Connected to or stems from a course goal | X | |
| Reflects successful student performance | X | X |
| May use broad language like “know” or “understand” | X | |
| Reflect essential questions for your course and/or discipline | X | |
| Targets one specific aspect of student performance | X |
Creating Goals
Think about the big learning goals – what is it you want students to know or understand? Goals provide ‘big picture’ aspirations.
Goals flow from the program or course description and provide a framework for determining the more specific program or course objectives/outcomes. Goals describe overarching expectations such as “Student will develop effective written communication skills” or “Students will understand the methods of science”.
Some approaches to writing goals are below. These are starting points:
- Review other programs or courses – Often broad overarching goal statements are similar from program to program and institution to institution.
- Think about an Ideal student – Describe the perfect student at the end of your course in terms of their knowledge, abilities, values, and attitudes. Think of what an ideal course would look like – state these ideas as broad goals.
- Review existing material – Review current materials (program materials, accrediting agency requirements, course descriptions, mission and vision statements, etc.) to help shed light on course goals. List 5-7 most important goals identified in these sources. Prioritize the list in terms of importance related to your topic and their contribution to a student’s knowledge, abilities, attitudes, and values.
Activity: Create a Goal Statement for Your Program or Course
Pick one of the approaches from the previous page. Consider these questions as you draft your statement:
- In what ways do I want students to be changed as a result of my program/course?
- What abilities do I want students to have as a result of my program/course?
- What perspectives, ideas and information do I want students to be able to use as a result of my program/course?
- How will my students be able to communicate what they have learned as a result of my program/course?
- In what ways will this program/course change students’ behavior as members of their communities?
Once you have written your goal statement, use this checklist to cross-check your work.
Are your goals:
Broad and state general intentions?
Consistent with your description?
Reflecting successful student performance/behaviors?
Aligned with accrediting agency competencies?
Structure of a Learning Objective
It may be difficult to know how to start writing a learning objective. Here are some questions to consider:
- What knowledge, skill or abilities should the ideal student demonstrate?
- How will students be able to demonstrate what they learned?
- How does this outcome align with the stated goals?
- Is the outcomes learning-centered, rather than teaching-centered?
An easy way to remember the structure of a learning objective is to follow the “ABCD” format (Mager, 1997). The learning objective does not have to be written in this order (ABCD), but it should contain all four of these elements:
- A – Audience
- B – Behavior that specifies what the student will be doing
- C – Condition under which the knowledge, skills, or abilities will be demonstrated
- D – Degree under which the performance will be considered acceptable
Examples:
Students attending the smoking cessation program will identify the five main effects of smoking on one’s health.
- Audience: students
- Behavior: identify the effects of smoking on one’s health
- Condition: attending the smoking cessation program
- Degree: five main (effects)
Activity: Creating Learning Objectives
Draft 3 learning objectives for a course. Identify in each statement the 4 components required in a learning outcome statement: audience, behavior, condition, and degree.
Drafting complete learning objectives takes more time than most initially think. With experience and practice, drafting complete statements does become easier.
Final Reflection
After completing the activities, reflect on your final product by responding to the questions below. You can do this exercise through either individual reflective writing or discussion with a partner.
- Did you find it difficult to write a complete learning objective with all 4 components?
- Did you find particular components you historically (unintentionally) leave out? Can you see the value in including them moving forward?
Resources
Mager, R. F. (1997). Preparing instructional objectives: A critical tool in the development of effective instruction. (3rd ed.). Atlanta, GA: CEP Press.
Chapter 5: How do I know if my learning objectives are appropriate?
Warm Up Activity
Review this list of common issues and concerns related to learning objectives. Which ones resonate most with you?
- How do I know if I have enough verbs or the right verbs in my learning objective?
- From what perspective should the learning objective be written? Since I am writing them, shouldn’t they be from the faculty perspective?
- How do I know if my learning objective is measurable and observable?
- How can I identify the acceptable level of performance of my students?
- Is the learning objective student-centered rather than teaching-centered? Does the statement describe what a student will DO?
As you continue reading, we will identify ways these issues can be addressed.
Common Pitfalls When Crafting Learning Objectives
It is a good idea to review existing learning objectives to see if they are written appropriately. There are several common mistakes people make when crafting learning objectives.
5 Concepts to Remember
Include only one action verb per statement: Do not ‘stack verbs’. Include only one action verb in a learning objective. Using more than one verb implies that more than one activity or behavior must be measured. It will be difficult to assess successful completion of a learning objective if a student has successfully achieved verb #1 but not verb #2. Remember, a great resource to use to find inspiration for action verbs, while considering different cognitive levels and knowledge dimensions is Bloom’s Taxonomy. Use this document.
Keep each statement student-centered: A common mistake is to write learning objectives from the perspective of the faculty member. Since you are typically in the planning/designing phase when you write learning objectives, it can be easy to mistakenly write objectives in terms of what you plan to do. However, since the point of objectives are to guide the learning and assessment process, learning objectives should be student-centered. What will the student achieve as a result of their learning?
Include an action word that is observable and measurable: What is likely the most important point about objectives is that they are observable and measurable. These two attributes are key to assessment. As a subordinate component in the inverted pyramid, assessment of learning objectives provides key information related to higher-level goal and outcome assessment activity. Remember, a great resource to identify observable and measurable action verbs, while considering different cognitive levels and knowledge dimensions, is Bloom’s Taxonomy. Use this document.
Include specific degree (criteria) for what you deem acceptable: Learning objectives also need to include criteria specifying to what degree you deem the action or behavior acceptable. This enables you to better judge your students’ achievements.
Keep your statements clear and simple: Overly complicated and wordy learning objectives are not as effective as those that simply and clearly state what students will have learned. The best learning objectives state one action verb, the acceptable degree, and condition under which the verb is performed (if not already implied).
Here are several questions you can use as a guideline/checklist to help you assess your learning objectives:
- Does the learning objective stem from a course goal?
- Does it clearly describe and define the knowledge, skill, or ability required achieved by the student at the end of the course or program?
- Can you identify the action word? Is it measurable and observable?
- Can you identify the acceptable level of performance?
- Is the learning objective student-centered rather than teaching-centered? Does the statement describe what a student will DO?
- Is it specific and simply stated?
- Does the learning objective match instructional activities and assessments?
- Are you able to collect accurate and reliable data for the stated objective?
- Is it stated so that more than one measurement method can be used?
- Can the objective be used to identify areas to improve?
- Given all stated course learning objectives, do they accurately reflect overall the key results of your course or program?
*Adapted from: Mandernach, B. J. (2003). Writing Quality Learning Objectives. Retrieved 28 March 2011, from Park University Faculty Development Quick Tips
Activity: Recognizing Effective Objective Statements
Self Assessment Activity
Final Reflection
After completing the activity, review your own learning objectives. Use the learning objective checklist for each statement. How well did you do? Consider working through this checklist with a colleague and exchanging learning objectives for review purposes.
Resources
Mandernach, B. J. (2003). Writing Quality Learning Objectives. Retrieved 28 March 2011, from Park University Faculty Development Quick Tips.
Chapter 6: What are the differences between learning objectives at the course level and learning outcomes at the program level?
Warm Up Activity: Aligning course, program and institutional learning objectives
Before you begin thinking about the relationship between the learning objectives at the course, program, and course level for your particular college or university, consider how other institutions have approached alignment for the purpose of increasing student learning. Select one or more of the links below. Does the approach of any of these institutions mirror the approach you would consider taking or is there a combination of these approaches that would be more appropriate for your needs?
Linking institutional and program goals
Assessment essentials for tribal colleges
Mapping learning outcomes – Contra Costa Community College
Levels of assessment – AAC&U
After you have explored one or more of the above sites, jot down one takeaway that you think should be considered as you focus on developing goals and objectives that are in alignment with your university/college mission and program and course goals and objectives.
Alignment at the Course, Program, and Institutional Level
In their book, Assessment Essentials, Palomba and Banta (1999) tell us that their research suggests that as a starting point for a successful assessment program, “faculty need to consider the institutions value, goals, and visions” (p. 6). Understanding the focus of the institution (experiential education, leadership, core competencies) guides the process of assessment and the use of its results.
In 2007 the AAC&U began its launch of the VALUE (Value Assessment of Learning in Undergraduate Education) rubrics in 16 specific areas of learning. According to Kansas State University, the VALUE rubrics have been embraced by all of the regional accrediting agencies. According to Peggy Maki, VALUE is recognized as “a national movement to change the way we envision and approach the assessment of student learning gains and accomplishments in college.”
Visit the AAC&U VALUE Rubric site and download a rubric that could be used to assess student learning in your institution, program, or course.
Activity: Writing Goals and Outcomes for the Course, Program, and Institution
Using the chart provided, identify which of the following statements could be written as a University Mission, a Program Goal, a Program Outcome, a Course Goal, a Learning Objective by inserting one of the following statements into the chart.
- Students learn about the process of identifying real-world ethical problems.
- Students understand how deeply held beliefs may hinder ethical decision-making.
- Seeks to develop ethical and responsible leaders committed to…
- Apply a solution to problem X from 3 different perspectives.
- Identify and acknowledge one’s own beliefs and assumptions.
Check Your Answers and view some sample answers.
Course-Level Learning Objectives Aligned with Curriculum Sequence
“The verbs that anchor an outcome statement need to take into account students’ chronology of learning, as well as their ways of learning, so that outcome statements align with educational practices.”
-Peggy Maki, Assessing for Learning: Building a Sustainable Commitment Across the Institution.
There are a number of taxonomies that you can use. A well-known framework for identifying learning goals is Bloom’s Taxonomy, and Linda Suskie (2009) suggests that there are some that have “filled in some voids and brought to the forefront some important goals not emphasized in Bloom’s” (p. 118).
Explore the features of some of the frameworks that can be used to create course learning objectives:
The 16 Habits of Mind identified by Costa and Kallick
Dimensions of Learning – Marzano, Pickering and McTighe
A Revision of Bloom’s Taxonomy of Educational Objectives
Activity: Writing Goals and Outcomes for the Institution, Program, and Course
- Institutional Level Goals and Objectives. Locate the mission statement of your College or University. Choose one goal and one of its outcomes. If there is no clearly stated goal, choose a phrase that suggests a learning goal and rewrite it as a goal. If there is no clear generalized outcome for the goal you chose (or wrote), articulate a generalized outcome for the graduates of your institution.
- Insert the institutional goal and outcome on the attached form.
- Programmatic Level Learning Goals and Objectives. Locate the associated goal and outcome in your program. If there is no associated goal or outcome, create your own (see instructions for creating goals and outcomes above). If there is an associated goal and outcome at the program level, rewrite it to align with the guidelines for writing goals and objectives above.
- Insert the program goal and learning objective on the attached form.
- Course Level Learning Goals and Objectives. Locate the course(s) in your program where these goals and outcomes exists. If there is no associated goal or outcome, create your own. If there is an associated goal and outcome at the course level, rewrite it to align with the guidelines for writing goals and outcomes.
- Insert the program goal and learning objective on the attached form.
NOTE: Ideally, this activity would be done within your department as you continue to articulate your goals and objectives.
Final Reflection
After completing the activities, consider the following questions. You can do this exercise through either individual reflective writing or discussion with a partner.
- Were you able to see a clear alignment? If not, consider who, on your campus, is responsible for embedding alignment into the assessment process.
- How would you convince the stakeholders that alignment is integral to the process of assessment?
Resources
Maki, P. L. (2012). Assessing for learning: Building a sustainable commitment across the institution. Sterling, VA: Stylus Publishing, LLC.
Suskie, L. (2009). Assessing student learning: A common sense guide. San Francisco, CA: Jossey-Bass.
Conclusion and resources
Summary of Key Points
- Choice of assessment terminology is linked to the institution’s approach to measuring student learning.
- Institutional goals must be related to the institutional mission.
- Institutions with multiple schools or colleges may find it helpful to construct program goals for each distinct school or college.
- Program goals are aligned with the school/college goals; course goals are aligned with program goals and outcomes.
- Consider accreditor guidelines when developing program goals.
- Everyone benefits from clearly stated and aligned goals, outcomes, and objectives.
- Goals are broadly stated and, therefore, cannot be measured.
- Learning objectives are observable and measurable.
- Learning objectives answer the question: what is it you want your students to be able to do as a result of the course activities that will provide evidence that they have met the particular learning goal?
- Learning objectives support better learning and performance, increase motivation, and helps focus strategies for teaching and assessment.
Reflection
Reflect and respond to the questions below. You can do this exercise through either individual reflective writing or discussion with a partner.
- How are goals and objectives defined at your institution?
- Why is it important to have clear learning goals and objectives?
- What would you say is the most important goal for graduates of your University?
- How might you use your hierarchy to review and revise your institution’s goals and objectives/outcomes?
- Why is it important to align course, program and institutional goals and objectives?
- Are your goals stated in broad terms and your objectives specific and measurable?
- Which stakeholders can you engage with to acquire the necessary information?
- Does your department(s) report to accrediting agencies? How much are you able to change based on their approval system?
- Do you need to submit changes to an institutional committee for approval?
Module Assessment: Goals & Objectives
Assessment Activity
Cited & Additional Resources
Barkley, E. F. (2010). Student engagement techniques: A handbook for college faculty. Hoboken, NJ:Â John Wiley & Sons.
Covey, S. R. (2004). The 7 habits of highly effective people: Restoring the character ethic ([Rev. ed.].). New York, NY: Free Press.
Diamond, R. M. (2011). Designing and assessing courses and curricula: A practical guide. Hoboken, NJ: John Wiley & Sons.
Huba, M. E., & Freed, J. E. (2000). Learner centered assessment on college campuses: Shifting the focus from teaching to learning. Community College Journal of Research and Practice, 24(9), 759-766.
Mager, R. F. (1997). Preparing instructional objectives: A critical tool in the development of effective instruction. (3rd ed.). Atlanta, GA: CEP Press.
Maki, P. L. (2012). Assessing for learning: Building a sustainable commitment across the institution. Sterling, VA: Stylus Publishing, LLC.
Mandernach, B. J. (2003). Writing Quality Learning Objectives. Retrieved 28 March 2011, from Park University Faculty Development Quick Tips.
Marzano, R. J., Pickering, D., & McTighe, J. (1993). Assessing Student Outcomes: Performance Assessment Using the Dimensions of Learning Model. Association for Supervision and Curriculum Development.
Palomba, C. A., & Banta, T. W. (1999). Assessment essentials: Planning, implementing, and improving assessment in higher education. San Francisco, CA: Jossey-Bass.
Suskie, L. (2009). Assessing student learning: A common sense guide. San Francisco. CA: Jossey-Bass.
Walvoord, B. E. (2010). Assessment clear and simple: A practical guide for institutions, departments, and general education. Hoboken, NJ: John Wiley & Sons.
Wiggins, G., & McTighe, J. (2004). Understanding by Design. Alexandria, VA: Association for Supervision and Curriculum Development.
Web Resources
AAC&U Liberal Education and America’s Promise (LEAP) Value Rubrics
Bloom’s Taxonomy
The 16 Habits of Mind identified by Costa and Kallick
Dimensions of Learning – Marzano, Pickering and McTighe
A Revision of Bloom’s Taxonomy of Educational Objectives
Introduction
Whether a faculty, staff, or administrator in higher education, this module provides a useful introduction to some of the important things to consider when gathering assessment data. Through completing this module you should be better able to identify the types of data you want to collect, and generate an assessment plan that outlines how this data will be collected to make evidence-based decisions. This module also allows you to identify potential promising practices to consider, and recommend changes when needed to change data gathering practices at your institution.
Gathering Data Facilitation Guide
LARC Beta-Testing Institutional Example 1
LARC Beta-Testing Institutional Example 2
LARC Beta-Testing Institutional Example 3
LARC Beta-Testing Institutional Example 4
Intended Audience:
This module is intended for faculty, staff, administrators, or other institutional stakeholders who:
- Consider themselves new to the assessment conversation;
- Are already involved in assessment efforts; and/or
- Are charged with training or educating their peers and colleagues about assessment.
Goals
This module is designed to help participants:
- Understand the importance of planning in the process of gathering assessment data
- Understand the range of factors that influence the quality of the data being collected and the practicality of collecting data in this manner.
- Recognize how the best practices in data gathering for assessment involve an assessment plan for collection and management of data that addresses the relevant educational inputs, outputs and experiences.
Objectives
Upon completion of this module, participants will be able to:
- Understand the components of the planning process when designing a new assessment effort or initiative.
- List factors one should consider before deciding which data to gather.
- Identify the intended audience for the assessment results.
- Compare various methods or approaches for gathering data.
- Choose appropriate methods or approaches for gathering data.
- Differentiate between assessment process inputs and outputs, and educational inputs, outputs, and experiences.
- Recognize best practices for data gathering.
- Recommend changes, if needed, to improve data gathering practices at your institution.
- Create a data gathering plan for a new assessment effort or initiative.
Chapter 1: What is the relationship between planning and the assessment process? How important is planning to effective data use?
Warm Up Activity
Write down the questions you are trying to answer about the assessment process. These questions might be about student learning, student engagement, course assessment, program assessment, institutional effectiveness, or other areas of interest. These questions will inform the process you use to decide what data to gather and how you gather it.
The video shares the experiences of different faculty members and administrators on planning for assessment to improve teaching and learning in each of their respective roles. After you listen carefully to their experiences, reflect on the content by answering the questions in the activity section below.
Activity: Reflecting on Shared Experiences
If you have generated additional ideas for questions after watching and reflecting on the video, please add them to your initial list.
After watching the video, write reflective responses to or discuss the following questions with colleagues:
- What differences if any did you notice in the different types of questions asked by the people in different positions (director of assessment, dean or chair, and faculty member)?
- In comparison to examples discussed in the video, who are your stakeholders, the people who would be interested in the answers to questions about teaching and learning?
- What questions might your stakeholders have that need to be answered?
- To what degree are the questions you would like answered connected to the goals and objectives for your course, program, unit, or institution?
- Revisit the questions you drafted. Are there additional questions you want to add to the list after viewing the video and reading through the list of questions and prompts?
Prioritizing Your Assessment Plan for Learning Goals and Objectives
Now that you have generated a list of potential questions about teaching and learning, it is time to try to prioritize these questions for the purpose of gathering data. Not all questions may be as worthy of our faculty and institutional time and energy, and the most important questions should be the ones that speak most directly to improving teaching and learning. To make these kinds of judgments you should carefully consider what your learning goals and objectives are for your students.
If you have already completed the module on Goal and Objectives (Insert link to Goals and Objectives module) you have gone through the process of identifying course, program, division or institutional goals and objectives for student learning. Even if you haven’t completed the module, you likely have an idea of the learning goals and objectives you have set for your course, for all students in your major, or for all students at your institution. You can also find sample goals and learning objectives here (provide link to resource page with samples). You should consider these goals and objectives carefully as you review and refine your questions.
It is important to note that this process is not about ignoring or removing questions, but only about prioritizing them. You should still be keeping all useful questions, particularly as they relate to your learning goals and objectives. For questions that are otherwise equally important in terms of their relationship to learning goals and objectives, you should consider a variety of other factors:
- Areas of concern: You may have data or anecdotal evidence that some learning objectives are not being met. You may want to prioritize asking the questions in these areas of concern.
- Institutional context: Your institution may be prioritizing certain goals and objectives over others as part of campus-wide work. It is possible that your work answering questions at the course, program or division level could contribute to a broader body of knowledge about students at your institution. If this is the case, you may want to prioritize asking questions related to these institution-wide goals and objectives.
- Temporal and accreditation needs: Your institution or program may be at a point in its review cycle when particular data is already being collected or needed for some purpose such as accreditation. If this is the case, questions related to that particular data may be particularly convenient or necessary to answer at this time.
- Ongoing cycle of assessment: Sometimes your campus, division or program is at the stage of collecting certain types of data, not because it is time-sensitive for accreditation, but because the institution has established a cycle of data collection to make the process more efficient. Even in the absence of such a plan, you can develop one for your institution, division, program or course. In this case sometimes your decisions about what questions to prioritize are arbitrary. You may prioritize answering some questions this year, and plan to answer the others next year or the year after that as part of a multi-year plan.
Activity: Beginning to Develop an Assessment Plan
This is an activity to allow you to think about the different ways in which you might prioritize your questions as part of an overall assessment plan. The table below will be one you work with throughout this module. The table can be downloaded here. At this point, you only need to begin to fill in the first two columns:
- What are the goals/objectives you are trying to achieve?
- What are the questions you are trying to answer?
Begin with your list of questions you generated in the Pre-activity and refined in the Activity Reflecting on Shared Experiences. Begin by trying to group them based on whether they are related to particular learning goals and objectives. Refer to the list of goals and objectives you generated if you completed the Goals and Objectives module or to a list of goals and objectives for your individual course, program, division or institution. Alternatively, you can select a sample list of goals and objectives from the Resources page. You may also use this opportunity to add even further questions to your list that arise as you group them. Because some questions may relate to multiple goals and objectives and vice versa, you may want to organize your questions and objectives in a concept map initially.
Once you have established links between your goals and learning objectives and your questions, begin to think about how to prioritize these questions based on their related goals and learning objectives for the table below. Are some questions more directly relevant to the goals and objectives than others? How should the goals and objectives related to the questions be prioritized in terms of:
- Areas of concern
- Institutional context
- Temporal and accreditation needs
- Ongoing cycle of assessment
Complete the table below with as many rows as you need to capture your highest priority questions and their related goals and learning objectives. What are the goal/objectives you are trying to achieve?
| What are the goals/objectives you are trying to achieve? | What are the questions you are trying to answer? | Category of data | Source of data/method of data collection | Timeline/deadlines | Roles and responsible individuals and groups? |
|---|---|---|---|---|---|
Final Reflection
After completing the activities, reflect on your final product by responding to the questions below. You can do this exercise either through individual reflective writing or discussion with a partner.
- While creating the final product, on which goals, objectives and questions did you decide to focus and why?
- What questions or challenges arose for you when completing this task?
- For group dialogue: What is one piece of advice or information that you would give your colleague if they asked for feedback on how to improve and/or re-prioritize this list of goals, objectives and questions?
Resources
Maki, P. L. (2010). Assessing for learning: Building a sustainable commitment across the institution. (2nd ed.). Sterling, VA: Stylus.
Chapter 2: What factors do I need to consider before deciding what data to gather?
Warm Up Activity
Now that you have articulated and prioritized your questions, begin to brainstorm some of the data you could potentially gather to answer these questions.
Create a list of this potential data. You can use your assessment plan table from the previous activity, but be prepared to change and rework your list as we begin to think about what factors should influence the type of data we gather.
Factors to Consider When Planning to Collect Data (1 of 3)
As you consider the types of data to collect, you must consider both what you are able to learn about the educational process from the data, which determines how relevant it is to your questions, and what you are going to be able to engage in with regard to the assessment process, which determines how practical it will be collect this data.
The factors related to the value of the data can be considered quality factors, while those related to the feasibility of assessment can be considered practical factors. In each case, we will be talking about inputs and outputs, but the inputs and outputs that are relevant to our quality factors are the student learning objectives themselves, while the inputs and outputs that are relevant to our practical factors are the resources we must expend to collect the data (inputs) and the data itself (outputs).
Factors to Consider When Planning to Collect Data (2 of 3)
Quality Factors: Related to Educational Process Inputs, Outputs, and Experiences
When considering the relevance of data to the question being asked, Astin and Antonio (2012) offer a model that conceptualizes the types of data you can collect as data on Educational Inputs, Outputs, and Experiences.
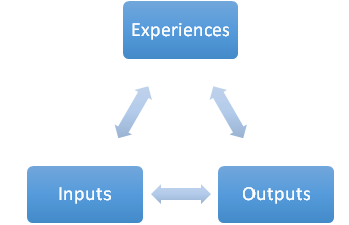
Educational Experience: In this context, the Educational Experience is the one you are asking the question about. It may be a single course, a series of courses in a program, all the courses a student takes at the institution, or the combination of those courses and the student’s co-curricular experiences to name just a few examples. The more data you have on the nature of the educational experience students are having, the better you will be able to gauge how it is or is not contributing to your student learning goals and objectives. As a very simple example it is worth knowing whether the course or courses you are interested in actually contain lessons and assessments designed to address the goals and learning
Educational Outputs: For Astin and Antonio (2012) the outputs of relevance for assessment represent the student learning you can measure after students have had the educational experiences under review. As we will discuss later, different kinds of data may serve as better or worse representations of these learning objectives, but the critical concern in this model is the extent to which you can link those learning objectives directly to the experiences students are having. To make the causal inference possible between the experience and the output of student learning it is important the output is measured after the experience, and that other possible contributions to the learning objective are controlled for as carefully as possible. For instance, if you want to know whether a particular course is impacting student writing, you should be concerned about what other courses and experiences might be contributing as well when collecting your data.
Educational Inputs: Perhaps the most challenging variable to control for in trying to link a particular educational experience to student learning is the learning students already have before they begin the experience, their educational inputs. These represent what you know about your students prior to the educational experience. Students who show very high achievement on an assessment after an educational experience may still have shown no gains as a result of that educational experience, if their initial level of achievement would have also been very high.
Inputs, Outputs, Experiences and Quality: The quality of data for the purposes of answering an educational question is not reliant on any of these three factors alone. Instead, the quality of the data you are collecting is dependent on having good measures for all three of these factors, in ways that allow you to link them together as indicated by the arrows in the diagram:
Educational inputs outputs: By using comparable measures for Educational inputs and outputs you can insure that you effectively measure growth in learning objectives.
Educational inputs experiences: By insuring that the educational input measures are relevant to the measures of experiences, you can be more confident you can assess the impact of the experiences.
Educational experiences outputs: Only when the educational experience measures are relevant to the measures of learning output can you analyze how the experience impacts learning.
Quality Factors: Reliability and Validity
While our ability to know and understand the relationships between our different measures of inputs, outputs and experiences are extremely important for determining whether our data can effectively answer a particular question, the quality of the data can also vary for any one measure as a function of how confident we are that we are really measuring what we think we are measuring. In most cases we take multiple measurements to try to capture our data and how well those measurements represent the information we seek can be represented as arrows on a target. The bulls-eye on the target represents what we are really trying to measure.
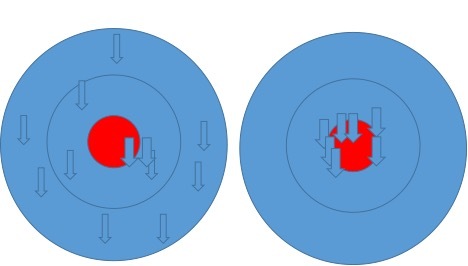
The target on the left represents measurements (arrows) that all fail to measure what we are really trying to measure. Such a series of measurements has low validity and low reliability. On the other hand, the target on the right represents measurements that all come very close to or successfully measure what we are really trying to measure. Such a series of measurements has high validity and reliability.
Validity: The validity of the measurement can be thought of as how well it is aimed at the bulls-eye in general, the degree to which our measurement really is measuring what we hoped it would. However, we understand that other variables can influence the metric, so it may not always be completely perfect in measuring the outcome.
Reliability: The reliability of the measurement can be thought of as how little it is impacted by other variables, such that each measurement is very similar to the measurement previously taken. This tendency of a measurement to be repeatable is independent of what it is really measuring.
To illustrate the difference and interaction of validity and reliability we can return to our target.
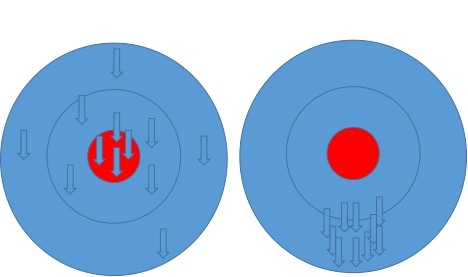
The target on the left in this case has a higher validity than the first target on the left as more of the arrows are in or close to the bulls-eye, measuring more closely what we hope to measure. However, there is not much improvement in the reliability as the arrows continue to be spaced out and not consistently producing the same measurement. On the other hand, the target on the right has very high reliability, but low validity as we are consistently measuring the same thing, but it is not the thing we hoped to measure (the bulls-eye).
Validity, Reliability and Quality: It can be difficult to estimate reliability and validity without doing rigorous data collection. However, we can consider some of the ways in which each can vary in terms of their effectiveness in measuring something related to a learning outcome:
- Content validity: Does the assessment accurately reflect all the learning objectives and only the learning objectives related to the goal or goals?
- Criterion-related validity: Do the scores of the assessment correlate well with other measures of the learning objectives?
- Construct validity: Do the assessment and the resulting scores really reflect successful mastery of learning objectives?
- Test-retest reliability: If you ask a student to complete the same assessment a second time would they receive comparable scores?
- Equivalent forms reliability: If the assessment can be used under different conditions such as on two different assignments by the same students with the same rubric would they get comparable scores?
- Scorer/Rater reliability: If the assessment has to be scored by raters and one rater scores the same work twice or two different raters score the same work with the rubric, would the work receive comparable scores?
As you decide what kind of data to collect, you should consider these questions about the quality of the measurements you are taking. However, there are also practical considerations.
Practical Factors: Related to Assessment Process Inputs and Outputs
Systems Diagrams are often used to consider a project or process such as in our case the assessment process. In its simplest form, such a diagram consists of Process Inputs on the left, the Process itself in the middle and Process outputs on the right.
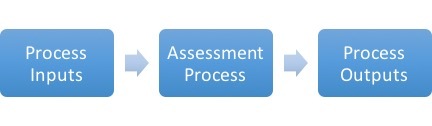
While fairly simple this kind of systems diagram can help us think about many of the practical or process-related factors that can influence the kind of data we collect.
Assessment Process inputs: In an assessment process there are a variety of inputs independent of student learning that we need to consider. Depending on the type of data we are planning to collect we may need a host of different resources including:
- Money
- Staffing
- Technology
- Equipment
- Assessment instruments
- Faculty or Staff time
- Capacity for data analysis
- Willingness of participants to provide data (issues of confidentiality or anonymity)
Each of these types of input factors may influence our decisions about the potential outputs that we can get at the end of the process.
Assessment Process: The process itself may have a variety of different steps that impact the inputs needed and the possible outputs. Some processes require more faculty involvement, some require more student involvement. Some processes take longer to complete, while others may be more rapid. As you may have noted from the Assessment Plan table, each of these considerations is taken into account: Timeline/Deadline and Who is responsible for gathering the data?
- Faculty roles in the process
- Student roles in the process
- Staff roles in the process
- Administrative roles in the process
- Timeline
These process factors not only have important implications for the inputs, such as faculty or staff time, but they are also critical to determining the sustainability of the process as an efficient process is likely to be most sustainable. Naturally, our decisions about how to insure relevance, validity and reliability of our data must all impact our process as they determine the instruments we use for the assessment process.
Assessment Process Outputs: The outputs of the process represent the data itself. The efficiency of the process is not just about minimizing the inputs needed, but it is also about maximizing the return in terms of quality data. While we have already addressed the issue of the quality of the data from the perspective of its relevance, validity and reliability, we have not considered the data in terms of the amount of data we gather, our sample of data. For our sample of data we can concern ourselves with both the size of the sample and how representative it is of the population we are sampling from.
Sample size: In general a larger sample can provide us with better representation of our what we are trying to measure. In fact, in terms of measuring student learning it may be desirable to measure every student. However, this has a direct impact on the inputs we need and the process we put in place, so it may not always be feasible.
Representative sample: In the absence of a comprehensive sample of all students, our processes should insure we get a representative sample of the population of students. This can be accomplished to some extent by randomly sampling from the population. Alternatively, it may be necessary or desirable to conduct stratified sampling in which we insure an appropriate level of representation in the sample from a variety of identified subpopulations of students such as based on gender, ethnicity, Pell eligibility, commuter/resident, student major, ethnicity, etc.
These practical considerations in terms of assessment process inputs, assessment process, and assessment process outputs are critical to consider alongside the quality considerations of the relevance of the data in terms of measuring educational inputs, experiences and outputs, and the validity and reliability of the data. It’s important to bear in mind that there is no one right way to balance these different factors, and data collection is just one aspect of the overall assessment process. A data collection plan should be viewed from the same perspective of ongoing improvement that is described for assessment overall in the module on assessment benefits and barriers.
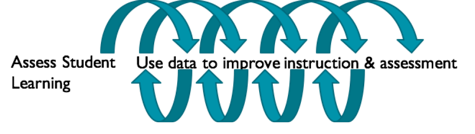
 Activity: Analyzing the Factors When Planning to Collect Data
In the Warm-up activity you brainstormed a list of potential types of data you could collect to answer your questions about student teaching and learning. For this activity you should return to that list. You can add to it as well, if you have new ideas about types of data that would be useful. Please transfer the list into this table and attempt to complete the rest of the table to begin to process the different types of considerations outlined in the section above. Some considerations to bear in mind for each of the columns:
- Educational Input, Output or Experience: The goal is to collect coordinated data for these three areas, but often individual data sources are relevant to only one of the areas. As you develop your table evaluate if you are collecting data relevant to each area.
- Higher or Lower Validity: As noted above, this can be difficult to evaluate, but try to judge where different data sources fall along a continuum from higher validity to lower validity. For instance, a student self-report of performance on a learning objective may have lower validity than a faculty evaluation of that student’s performance from classwork.
- Higher or Lower Reliability: This is also difficult to evaluate, but once again judge how a data source might rank from higher to lower in terms of the reliability of the data. For instance, a student self-report of performance on a learning objective might have higher reliability than a faculty evaluation, particularly if the faculty evaluation is based on a limited amount of student work, and a number of external variables could influence the student’s performance on that work sample.
- High, Low and Type of Process Input Needs. Process input can involve technology, finances, and human capital among other factors. Note whether a particular data source is particularly high or low in terms of the need for one of these forms of input. For instance, an internally developed survey involves a moderate technology need, while an externally administered survey may not require this need but has a higher financial cost.
- Intensity of Process Roles and Timeline: Different data sources can have a greater intensity in terms of the roles and timeline involved for different members of the campus community. For instance, the development of e-portfolios is a very time intensive process for the students and faculty involved, while an exit exam has a shorter timeframe and may involve administrators more than faculty.
- Higher and Lower Process Output: Different data sources have the potential to yield more representative or less representative samples of data. For instance, surveys often have very low response rates and are biased towards students interested in responding, while artifacts of student work can be collected systematically across the student population.
As you complete the table take some time to note the trade-offs in terms of the factors to consider. Some types of data sources are consistently Higher or Lower for certain factors.
| Data Source | Educational Input, Output or Experience | Higher or Lower Validity | Higher or Lower Reliability | High, Low and type of Process Input Needed | Intensity or Process: Roles and Timeline | Higher and Lower Process Output |
|---|---|---|---|---|---|---|
An Analysis and Inventory of the Different Kinds of Data Sources (1 of 3)
Linda Suskie (2009) suggests a “toolbox” of assessment instruments that include home-grown assignments or subjective tests with associated scoring guides and rubrics, home-grown objective tests, student reflection, interviews and focus groups, home-grown surveys and published tests and surveys. Each of these sources of data can differ from one another in terms of one or more of the factors we have already discussed. In order to better understand this variation, it is possible to group these data sources and others that can be added to the list into categories based on the kind of data they produce: qualitative vs. quantitative vs. mixed methods, data on learning objectives vs. engagement, vs. attitudes, values, dispositions and habits of mind, direct vs. indirect measures, and flexible v. standardized.
If you have already completed the “Demystifying Assessment Module”, you will be familiar with some of these concepts. However, rather than simply defining them, we approach them in this module in terms of the factors we have discussed above and other considerations about when and how to use these kinds of assessments.
An Analysis and Inventory of the Different Kinds of Data Sources (2 of 3)
Analysis
Qualitative vs. Quantitative vs. Mixed Methods: Assessment instruments can provide us with two different kinds of data: quantitative data that allows us to make statistical comparisons, such as a score on a Likert scale or a test and qualitative data that captures a broader range of potential responses, such as an open response question on a survey or quiz. Some assessment instruments have the benefit of allowing for both quantitative and qualitative data.
Quantitative data: This kind of data can benefit from having relatively higher reliability, as the data is constrained to specific scores, and the scoring process can allow for relatively higher assessment process output with lower inputs as the scoring can be mechanized or at the very least simplified through tools like rubrics, decreasing the intensity and timeline for producing this kind of data relative to qualitative data.
Qualitative data: A case can be made that qualitative data has the potential for higher validity as the open responses and flexible analysis of those responses can capture data that would be lost in the more restricted responses and/or scoring that produces quantitative data. However, there can be a greater subjective element to analyzing these responses that not only sacrifices reliability but can also sacrifice validity, and involves a much higher human resource assessment process input, for a given amount of output with a higher intensity and longer timeline for producing this kind of data as scorer needs to read through and categorize a wide range of responses.
Mixed methods: The approach of capturing both qualitative and quantitative data using a single assessment instrument offers the potential to benefit from both the higher reliability of quantitative measures along with the potential for high validity from qualitative data. This occurs at a very high human resource cost and a higher intensity and timeline for involvement in the work. While this can result in lower potential assessment process output in the form of data, it is also possible to maximize the quantitative data output by scoring everything quantitatively while mitigating some of the input costs process intensity and time by only conducting the qualitative analysis on a subset of the full sample.
| Category of Data | Higher or Lower Validity | Higher or Lower Reliability | High, Low and type of Process Input Need | Intensity of Process: Roles and Timeline | Higher and Lower Process Output |
|---|---|---|---|---|---|
| Quantitative | Depends on the instrument and in some cases scorer | Higher | Lower | Lower intensity and shorter timeline | Higher |
| Qualitative | Depends heavily on the scorer | Lower | Higher | Higher intensity and longer timeline | Potentially Lower |
| Mixed | Depends on the instrument and the scorer | Highest | Highest intensity and longest timeline | Potential for Highest |
Measuring learning objectives vs. engagement, vs. attitudes, values, dispositions and habits of mind: The data you collect can also vary in terms of what it is measuring about students. We can measure what the students are actually learning, how engaged they are in the learning process, and how they feel about and approach the learning process. There can be some overlap between these categories, and some instruments can capture more than one kind of data in this regard.
Measuring learning objectives: Learning objectives can be assessed in a wide variety of ways from scoring artifacts of student work with rubrics to standardized testing, but the common denominator is that we are trying to evaluate what our students know and are able to do with their knowledge and skills. This data is critical for determining the educational inputs and outputs in our analysis of student learning. The levels of validity and reliability vary widely with the instruments used as do the input needs, intensity, timeline and outputs, but in general it requires a relatively high investment of inputs, intensity and timeline relative to the outputs.
Measuring engagement: Student engagement represents a measure of the extent to which our students are active participants in their own learning. This is a growing area of data as we move from course evaluations and surveys to online course usage data, student enrollment data, and even biometrics. The important distinction about this data is although we can certainly measure level of engagement as both an educational input and output, we can also measure it as part of the educational experience in a particular course or program of study. Most of the ways in which we measure engagement vary in their validity as a function of the instrument used, but have potential for higher reliability as the measures of engagement are less subjective than some of the measures of student learning, and while they may often require greater technological inputs through survey administration, student records mining and biometrics, they seldom require much input, or intensity on the part of students and faculty relative to the potential data output.
Measuring attitudes, values, dispositions, and habits of mind: For some of our questions about teaching and learning, we are particularly interested in how the educational experience may shape our students’ perspectives, priorities, behaviors, and interests more than their knowledge and skills. There are a variety of ways to measure these things including from student reflection, behavioral observations, interviews, focus groups, and surveys. These measurements can overlap with measurements of engagement which could be considered dispositional and like measures of engagement can be measured as educational inputs, as a window into the educational experience, and as an educational output. Validity and reliability vary with the instrument used, as do the investments in terms of inputs, intensity, and timeline and the resulting assessment process outputs.
| Kind of Data | Educational Input, Output or Experience | Higher or Lower Validity | Higher or Lower Reliability | High, Low and type of Process Input Need | Intensity of Process: Roles and Timeline | Higher and Lower Process Output |
|---|---|---|---|---|---|---|
| Learning Objectives | Educational Input and Output | Depends on the instrument | Variable lower reliability | Variable higher inputs | Higher intensity, long time | Variable |
| Engagement | Input, Experience and Output | Depends on the instrument | Higher reliability | High technology, low other | Lower intensity, short time | Higher potential outputs |
| Attitudes, values, etc. | Input, Experience and Output | Depends on the instrument | Variable lower reliability | Variable inputs | Variable intensity and time | Variable |
Direct and indirect measures: It may be more useful to think of the relationship between indirect and direct measures as a continuum rather than a dichotomy. Some types of data tend to come from directly measuring the learning outcome, engagement or attitude directly in a teaching and learning context, while others tend to rely more heavily on our ability to infer the objective, engagement or attitude without measuring it directly. For instance, an assignment in a course may be designed to directly assess a particular student learning objective, but even if there are multiple assignments like that one in the course, as long as the final course grade takes into account other factors such as assignments that assess other objectives and consideration for course participation, student final grades represent a more indirect measure of the student learning. However, if students in that same class are asked to rate their own student learning, that would be arguably an even more indirect measure as there are likely even more variables that contribute to a student’s self perception of their learning including their capacity to accurately assess that learning.
Direct measures: In general, direct measures of student learning are considered to have more validity than indirect measures, although that validity is still dependent on the instrument as is the reliability of the measure. Direct measures tend to have higher assessment process inputs than indirect measures, but those inputs can be more financial in cases where an external test is purchased and in human resources when a locally developed test or assignment is used. The intensity and timeline for the process can be less with external tests and much more with locally developed assessments, but in each case the assessment process output can be limited by the resources required.
Indirect measures: Indirect measures while potentially less valid, can have reasonably high reliability as students tend to perform consistently in areas like grades and to be consistent in their perspective on their own knowledge, skills, engagement and disposition. The assessment process inputs tend to be less along with the intensity and timeline with the potential for relatively high outputs. However, for indirect measures like surveys, the outputs can be limited by response rates.
| Category of Data | Higher or Lower Validity | Higher or Lower Reliability | High, Low and type of Process Input Need | Intensity of Process: Roles and Timeline | Higher and Lower Process Output |
|---|---|---|---|---|---|
| Direct | Higher depending on the instrument and sometimes scorer | Depends on the instrument | Higher | Higher intensity and longer timeline | Lower |
| Indirect | Depends heavily on the scorer | Potentially higher | Lower | Lower intensity and shorter timeline | Potential higher |
Customized vs. Standardized: Assessment instruments can differ in terms of whether they provide a standardized set of data that can be compared across multiple administrations of the same instrument at different campuses and over time or whether they are unique to a particular time and place limiting the potential for comparisons. The benefits of an assessment instrument that is unique to a particular time and place is that it is flexible and can be customized to reflect the assessment questions being asked in a particular year at a particular institution. However, while standardized tests are often thought of as exclusively containing close-ended responses to insure comparability, this is not always the case as comparability is also created through the use of rubrics and scorer norming and training. Therefore, the distinction between standardized assessments and other customized assessments is primarily related to this issue of flexibility.
Customized: A customized assessment is one that can be or has been changed to the needs of a particular institution, program or year. Sometimes these are also referred to as home-grown or locally developed assessments. They have the potential to have higher validity because they can be designed to address the specific learning objectives or other measures in which a program is interested. Furthermore, the flexibility of design helps insure they can be made relevant to the student learning experience, so students take them seriously. This flexibility comes at a cost in terms of relatively higher assessment process inputs, particularly in terms of human resources and higher assessment process intensity, particularly through faculty roles, and longer timelines because of the development time needed. Finally, the scoring of these assessments may be harder to automate in any way, potentially reducing the assessment process output.
Standardized: Standardized assessments offer common prompts, questions and tasks from year to year and institution to institution. They tend to undergo rigorous testing to insure validity and reliability and as a result are likely more reliable than more flexible assessments. However as noted above their validity while excellent for the objectives they are designed to assess, may not be so strong for the objectives you actually want to assess. Furthermore, if the standardized assessment is an externally developed instrument, standardized tests may not engage student interest and motivation the way a customized, locally developed or adapted instrument can, further limiting their potential validity. In many cases the assessment process inputs are financially high, but not high in terms of human resources, and the process intensity can be lower and the timeline shorter. As a result they offer the potential for higher assessment process outputs. The potential to make comparisons across institutions is very appealing for the subsequent analysis of the data, but can also be mitigated if different institutions have different priorities.
| Category of Data | Higher or Lower Validity | Higher or Lower Reliability | High, Low and type of Process Input Need | Intensity of Process: Roles and Timeline | Higher and Lower Process Output |
|---|---|---|---|---|---|
| Customized | Higher depending on what needs to be assessed | Depends on the instrument | Higher | Higher intensity and longer timeline | Lower |
| Standardized | Lower if instrument does not match local objectives | Potentially higher | Lower | Lower intensity and shorter timeline | Potentially higher |
An Analysis and Inventory of the Different Kinds of Data Sources (3 of 3)
Inventory
Now that you have had the chance to examine 4 ways in which we can categorize kinds of data, let’s return to Linda Suskie’s ‘Toolbox’ and discuss a range of different potential sources of data:
Assignments or subjective tests with associated scoring guides and rubrics: Assignments and subjective tests allow open-ended responses and are almost always customized, home-grown instruments that can be assessed with customized, home-grown rubrics and/or scoring guides. They offer direct assessment of student learning objectives and can provide both quantitative data in the form of scores and qualitative data in the form of scorer comments and qualitative analysis of open responses. In spite of their customized nature, there is a growing national movement to offer some semblance of standardization for these instruments through the development of the Association of American Colleges and Universities (AAC&U) Liberal Education and America’s Promise (LEAP) Valid Assessment of Learning in Undergraduate Education (VALUE) rubrics and the National Institute for Learning Objectives Assessment (NILOA) Assignment Library of assignments designed to assess many of the learning objectives covered by the VALUE rubrics. In addition, while many standardized tests avoid subjective scoring the College Learning Assessment (CLA) is one standardized test that includes subjective scoring of student essays.
Home-grown objective tests: Objective tests contain only questions with close-ended responses to insure greater reliability. When home-grown, they offer a customized approach to direct assessment of student learning objectives and provide predominantly quantitative data, although scorers could be prompted to add some qualitative comments about the overall patterns of performance observed in a particular set of student responses.
Student reflection: Reflective essays or journals from students allow for open-ended responses, providing a customized approach to direct assessment of student learning objectives, student engagement, attitudes, values, dispositions and habits of mind. They provide predominantly qualitative data, although rubrics could be employed to provide quantitative scores to reflective essays or journals.
Interviews and focus groups: These approaches to assessment provide customized, direct and indirect assessments of student learning objectives, student engagement, attitudes, values, dispositions and habits of mind. They provide almost exclusively qualitative data and in general most of the data is indirect as students are being asked how to answer questions about themselves and their experiences, but it would also be possible to ask direct questions to assess learning objectives, and to develop rubrics to quantify student responses.
Observations: Student observations while they are engaged in academic or professional tasks or presentations offer customized direct assessment of student learning objectives, student engagement, attitudes, values, dispositions, and habits of mind. They can provide both qualitative and quantitative data provided a rubric is used along with detailed notes.
Home-grown surveys: Surveys developed at an institution provide the opportunity for customized, indirect assessment of student learning objectives, student engagement, attitudes, values, dispositions and habits of mind. They can provide quantitative data through a Likert scale and qualitative data through the analysis of open response questions.
Student records: Data from student records on course enrollment, course completion, course withdrawals and grades can be used for customized, indirect assessment of student learning objectives (provided you know the objectives addressed in the courses) and student engagement. This approach provides only quantitative data.
Published tests: Data from published tests provides standardized, direct assessment of student learning objectives. They provide only quantitative data.
Published surveys: Data from published surveys provide standardized, indirect assessment of student learning objectives, engagement, attitudes, values, dispositions and habits of mind. They only provide quantitative data.
Social media and other big data: Data from students’ online footprint, particularly in the context of their activity in online courses can provide standardized or customized, direct or indirect assessment of student engagement, attitudes, values, dispositions and habits of mind.
Course syllabi: Data from course syllabi, particularly published course learning objectives, instructional activities and assessments, can provide customized, highly indirect assessment of student learning objectives. This data is almost exclusively qualitative.
| Data Sources | Qualitative vs. Quantitative | Learning objectives vs. Engagement, etc. | Direct vs. Indirect | Customized vs. Standardized |
|---|---|---|---|---|
| Assignments or subjective tests | Both | Learning Objectives | Direct | Customized |
| Home-grown objective tests | Quantitative | Learning Objectives | Direct | Customized |
| Student reflection | Qualitative | Both | Both | Customized |
| Interviews and focus groups | Qualitative | Both | Both | Customized |
| Observations | Both | Both | Direct | Customized |
| Home-grown surveys | Both | Both | Indirect | Both |
| Student records | Quantitative | Both | Indirect | Both |
| Published tests | Quantitative | Learning Objectives | Direct | Standardized |
| Published surveys | Quantitative | Both | Indirect | Standardized |
| Social media and other big data | Both | Engagement, etc. | Both | Both |
| Course syllabi | Qualitative | Learning Objectives | Indirect | Customized |
Activity: Continuing to Build Your Assessment Plan
You began to develop your assessment plan previously by identifying the goals and objectives you were trying to achieve and the related questions you were trying to answer. Since that point we have been thinking first about different sources of data and the factors we need to consider about each source of data. We have since explored an inventory of potential sources of data and identified how they could be grouped into different categories of data.
For this next activity, return to your assessment plan and list the sources of data for each of the questions you are trying to answer. It’s ok if a particular question has multiple sources of data. For each source of data, identify what categories of data are represented in terms of direct and indirect, quantitative and qualitative, flexible and standardized, and learning objectives, engagement, dispositions, etc. As you complete the table bear in mind the potential benefits of balancing these different kinds of data.
| What are the goals/objectives you are trying to achieve? | What are the questions you are trying to answer? | Category of data | Source of data/method of data collection | Timeline/deadlines | Roles and responsible individuals and groups? |
|---|---|---|---|---|---|
Final Reflection
After completing the activities, reflect on your product by responding to the questions below. You can do this exercise through either individual reflective writing or discussion with a partner.
- While creating the product, on which types of data and sources of data did you decide to focus and why?
- What questions or challenges arose for you when completing this task?
- For group dialog: What is one piece of advice or information that you would give your colleague if they asked for feedback on how to improve and/or re-prioritize this list of goals, objectives, questions, types of data and sources of data?
Resources
Astin, A. W., & Antonio, A. L. (2012). Assessment for excellence: The philosophy and practice of assessment and evaluation in higher education. (2nd ed.). Lanham, MD: Rowman and Littlefield.
Suskie, L. S. (2009). Assessing student learning: A common sense guide. (2nd ed.). San Francisco, CA: Jossey-Bass.
Chapter 3: What are the best practices for gathering data?
Warm Up Activity
What kinds of methods for gathering data are you familiar with? Identify some of the best approaches to gathering data you have seen at your own institution or other institutions. You can respond to this question through either individual reflective writing or small group discussion.
The video shares the experiences of different faculty members and administrators on gathering data to improve teaching and learning in each of their respective roles. After you listen carefully to their experiences, reflect on the content by answering the questions in the activity section below.
Activity: Reflecting on Shared Experiences
If you have generated additional ideas for methods or approaches to gathering data, please add them to your initial list.
After watching the video, write reflective responses to, or with colleagues discuss the following questions:
- In comparison to examples discussed in the video, what do you see as some of the biggest roadblocks you might encounter in collecting data?
- Why is it important to have policies or procedures in place for storing data you have gathered?
- How can you envision making the data gathering process easier on your campus?
- Revisit the best approaches to gathering data that you drafted. Are there ideas you want to add to the list after viewing the video and reading through the list of questions and prompts?
- In what ways at your institution do you envision using multiple different sources of assessment data to get a better understanding of student learning?
Revisiting the Assessment Process
Earlier in this module as we introduced the assessment process we used two different models to identify both quality and practical considerations when gathering data. As you prepare to complete your Assessment Plan, these models can help you to think about the critical information you need for your timeline/deadlines and your Roles and Responsible individuals and groups. This will also insure that you are collecting all of the appropriate data you need to answer the questions you have identified.
The first model you learned about was Astin and Antonio’s model of inputs, experiences and outputs:
From the perspective of setting a timeline and roles and responsibilities for gathering data, this model is particularly important because it reminds us of three possible time points at which we must be collecting data, and for which someone must be responsible for the data collection:
- Educational Inputs: As you develop your timeline and deadlines, you must consider who will be responsible for collecting data on the educational inputs and when that data will be collected. In many cases this is the earliest data that can be collected because it measures student learning, engagement or dispositions prior to the educational experience. Be sure to identify when and by whom this data will be gathered.
- Educational Experience: In developing your timeline, deadlines and roles and responsibilities you must also consider when and how you will collect information on the educational experience the students are having. In some cases this may need to be collected while the experience is underway. Some elements of the educational experience can be collected before or after the experience itself, using documents like syllabi that outline the nature of the educational experience before it occurs, or surveys of students shortly after the experience when they still have a firm recollection of it.
- Educational Outputs. Finally, it is critical that you consider when and by whom the educational outputs will be measured. Those by necessity should come after the educational experience has been completed. Therefore, these may be some of the last data gathered in your timeline.
Using Astin and Antonio’s model allows us to insure we know who will be collecting the critical data at the appropriate time. However, earlier in this module you also learned about a basic systems diagram for the process of assessment.
This diagram serves as a reminder that the timeline/deadlines and roles and responsibilities can’t be limited to only the process of gathering the data itself.
- Assessment Process Inputs: Process inputs represent those resources that need to be made available for the assessment process to run smoothly. The timeline and deadlines need to reflect those resources being put into place and the roles and responsible individuals and groups needs to identify who will be insuring that those necessary supports are in place.
- Assessment Process: The Assessment process or in this case the data gathering component of the larger assessment process certainly consists of the data gathering steps necessary for measuring educational inputs, educational experiences and educational outputs. However, given that this is a multi-step data-gathering process, and those steps may not all be the responsibility of the same people, there may need to be someone overseeing and coordinating the whole process. The timeline/deadlines and roles and responsibilities should reflect who is overseeing the entire process and how they are monitoring the different steps.
- Assessment Process Outputs: The data gathered from the assessment process represents the assessment process outputs. However, this output needs to be organized and stored in some way so that it can ultimately be analyzed and used to improve teaching and learning. The timeline/deadlines and roles and responsible people and groups should note when and by whom the data that has been gathered will be collected, organized, analyzed and stored for future use. While the use of data will be covered in another module on using assessment data (provide link to the other module), a good assessment plan anticipates that the data will ultimately be used.
By revisiting our models for the assessment process, and some of the best approaches to gathering data shared in the video you should be able to insure that your assessment plan has a comprehensive timeline and assignment of responsibilities.
Activity: Completing Your Assessment Plan
You have developed your assessment plan by identifying the goals/objectives you were trying to achieve, the related questions you were trying to answer, and types and sources of data to answer those questions. Since that point we have been considering more broadly what insures a productive approach to gathering data. We have also explored some of the considerations we should keep in mind when we are developing a timeline and roles and responsibilities for our plan.
For this final activity, return to your assessment plan and complete the timeline/deadlines and roles and responsible individuals and groups. The table will probably start to get complicated as there may be multiple sources of data, deadlines and responsible parties for each pair of goals and questions. As you complete the table take a look back and consider how well you have prioritized your questions, kids and sources of data, timeline and roles.
| What are the goals/objectives you are trying to achieve? | What are the questions you are trying to answer? | Category of data | Source of data/method of data collection | Timeline/deadlines | Roles and responsible individuals and groups? |
|---|---|---|---|---|---|
Final Reflection
After completing the activities, reflect on your product by responding to the questions below. You can do this exercise through either individual reflective writing or discussion with a partner.
- While creating the final product, what roles and responsibilities did you assign and why?
- What questions or challenges arose for you when completing this task?
- For group dialog: What is one piece of advice or information that you would give your colleague if they asked for feedback on how to improve and/or re-prioritize this list of goals, objectives, questions, types of data, sources of data, timeline/deadlines and roles and responsible individuals and groups?
Resources
Astin, A. W., & Antonio, A. L. (2012). Assessment for excellence: The philosophy and practice of assessment and evaluation in higher education. (2nd ed.). Lanham, MD: Rowman and Littlefield.
Suskie, L. S. (2009). Assessing student learning: A common sense guide. (2nd ed.). San Francisco, CA: Jossey-Bass.
Conclusion and resources
Summary of Key Points
Planning and the Assessment Process
- The assessment questions that need to be answered vary between courses, programs, units, institutions, and other stakeholders and impact the data to be collected.
- Planning is essential to insure the necessary data is collected to answer the appropriate questions.
- Planning involves prioritizing the questions you want answered in terms of areas of concern, institutional context, timeliness and accreditation/accountability, and their position in the ongoing cycle of assessment.
Deciding What Data to Gather
- Deciding about the data to collect involves considering factors related to both the quality of the data for answering your questions, and the practicality of being able to collect the data.
- High quality data for answering questions about student learning should include data about students prior knowledge (inputs), the ways in which they are interacting with the curriculum (experiences) and the learning they demonstrate as a result (outputs).
- High quality data should be able to be measured consistently across different measurement circumstances (reliability) and should accurately measure what it is intended to measure (validity).
- In order for data collection to remain practical, it is important to consider the many resources needed for the data collection (process inputs), the steps involved in collecting the data (assessment process), and the amount of data that can be collected through these processes (process outputs).
- One approach to balancing the practical considerations of data collection is to consider the amount of data that can be collected (sample size) in a way that insures it reasonably accurately represents the diversity of students and student experiences (representative sampling).
- In order to maximize the quality and quantity of data collected it is essential to collect different types (categories and sources) of data, as each type can offer advantages and disadvantages in terms of validity, reliability, process input requirements, assessment process requirements, and overall data output.
Best Practices for Gathering Data
- When planning for data collection, develop a timeline and assign data collection responsibilities that insure the data on educational inputs, experiences, and outputs can be collected when it is most readily available and by the individuals who most easily can access this data.
- Facilitating faculty engagement is critical to the data collection plan as they are most often the individuals with the most access to educational inputs, experiences and output data.
- When planning for data collection, develop a timeline and assign data collection responsibilities that provide the necessary resources (process inputs) in a timely fashion, insure that each of the necessary steps (assessment processes) is carried out, and the data (process outputs) can be gathered and efficiently stored for future use.
- Providing for staffing and technological support are critical to the data collection plan as the process of collecting multiple data sources and potentially using data in multiple ways requires an institutional commitment to the assessment process, including the necessary resource inputs and data outputs.
Reflection
Look over your completed assessment plan. Can you articulate rationales for each question you are trying to answer (or outcome you are trying to achieve), each source you chose, and the process you proposed for gathering the data (when and who)?
Reviewing and reflecting on your assessment plan with a critical eye may help you to identify gaps or revisions that need to be made and ensure that you will be able to justify your decisions.
Module Assessment: Gathering Data
Assessment Activity
Cited & Additional Resources
Astin, A. W., & Antonio, A. L. (2012). Assessment for excellence: The philosophy and practice of assessment and evaluation in higher education. (2nd ed.). Lanham, MD: Rowman and Littlefield.
Maki, P. L. (2010). Assessing for learning: Building a sustainable commitment across the institution. (2nd ed.). Sterling, VA: Stylus.
Suskie, L. S. (2009). Assessing student learning: A common sense guide. (2nd ed.). San Francisco, CA: Jossey-Bass.
Introduction
Using Assessment Data Facilitation Guide
LARC Beta-Testing Institutional Example 1
LARC Beta-Testing Institutional Example 2
LARC Beta-Testing Institutional Example 3
LARC Beta-Testing Institutional Example 4
LARC Beta-Testing Institutional Example 5
Intended Audience
This module is intended for faculty, staff, administrators, or other institutional stakeholders who:
- Are already involved in assessment efforts;
- Are charged with using data to effect change; and/or
- Are charged with training or educating their peers and colleagues about assessment.
Goals
This module is designed to help participants:
- Understand the ways in which assessment data can be used for improvement at different institutional levels and to make evidence-based decisions for different purposes.
- Analyze the range of ways we can interpret and present assessment data using benchmarks to different stakeholder audiences.
- Recognize how the best practices for closing the loop involves a data management and sharing plan that addresses potential improvements to teaching and learning.
Objectives
Upon completion of this module, participants will be able to:
- Identify the micro and macro level purposes of gathering assessment data.
- Describe how assessment data are useful for institutional improvement.
- Recognize best practices for effectively using data to make evidence-based decisions.
- List the range of ways assessment data can be used at various levels of an institution.
- Identify appropriate benchmarks when designing a new initiative.
- Identify appropriate benchmarks when comparing two sets of data.
- Choose effective methods for presenting data to a range of stakeholder audiences.
- Recognize ineffective methods for presenting data.
- Select appropriate methods for ‘closing the loop’ once data gathering and analysis is complete.
- Identify ineffective uses of data.
- Recommend changes, if needed, to improve the use of assessment data at your institution.
- Create a plan that articulates how results from data will be shared.
Chapter 1: How can and should assessment data be used?
Warm-Up Activity
Case Study: Using Assessment Data
Why so much collection – but so little utilization – of data? Most institutions have routinized data collection, but they have little experience in reviewing and making sense of data. The Wabash National Study 2011
Please note that this case study involves the first phase of a discipline based, multi-year assessment project, which, over time, provided useful and practical information that engaged both program and institutional learning outcomes. For detailed information concerning innovative, emerging, and interdisciplinary assessment research and curriculum design on Scientific Thinking and Integrative Reasoning Skills (STIRS).
Part 1:
Juan was a capable student in BIO 111 — ‘Foundations of Biology,’ a student who had often stopped by during office hours to talk about a topic recently covered in class or ask for additional feedback on a lab report. The first time Juan stopped by your office it was close to the beginning of the semester and he was concerned because he felt he had done poorly on a pre-test in Bio 111 that asked students to classify pictures that were representative of particular phases of mitosis and meiosis. Juan indicated that he didn’t really remember anything about Mitosis and Meiosis from High School and wondered how could he be expected to do well if he was being tested on things that hadn’t even been taught yet. You reassured Juan that the pre-test would not affect his grade but would provide useful information when you were planning future lessons on Mitosis and Meiosis.
Later in the semester when Juan had successfully completed the bulk of the Foundation course with ‘B’ range grades on his tests and assignments, he stopped by again. He had just taken the final exam and was worried about how he had done on it. In the midst of discussing all the different parts of the exam, he commented “I can’t believe you put that same question on Mitosis and Meiosis on the final that was on the pre-test. That was pretty sneaky.” You asked him if he thought he had done any better on that question this time around and he acknowledged that he thought he did.
Consider the two identical questions Juan was asked on the pre-test and on the final exam.
- How was the individual course instructor likely using the results of those assessments at the course level to have a positive impact on Juan’s learning?
- How might the course instructor be collaborating with other faculty teaching BIO 111 to use the results of those assessments to have a positive impact on student learning in the course overall?
- How might the department as a whole be using the results of those and other assessments to have a positive impact on student learning in the program of study?
- In what ways might the institution as a whole be using the results of those assessments to improve student learning across the curriculum?
The video shares the experiences of different faculty members and administrators in using assessment data to improve teaching and learning in each of their respective roles. After you listen carefully to their experiences, reflect on the content by answering the questions in the activity section that follows.
Activity: Reflecting on Shared Experiences
After watching the video, write reflective responses to, or with colleagues discuss the following questions:
- How can assessment data be used in both a timely, responsive fashion, for immediate improvement, and in a planned, inclusive and structured process for evaluation and revision?
- How can assessment data be integrated for course, program and institution-level improvement?
- What are some of the best practices for effectively using data to make evidence-based decisions?
Best Practices for Effectively Using Data to Make Evidence-Based Decisions
Now that you have reflected on both Juan’s case study and the experiences of other faculty and staff members from the video, let’s examine some important considerations when trying to use assessment data effectively at your institution.
1. Put the Data in Context:
For many faculty and staff attempting to make evidence-based decisions using assessment data, the data in and of itself will have little meaning. Putting the data in context requires providing some frame of reference for those planning to use the data of what the results mean for student learning. As we will see in the next section of this module, benchmarks and standards provide one frame of reference to which assessment results can be compared. However, putting the data in context may require moving beyond the individual numbers and their comparison benchmarks, and sharing information about the source of the data. This can involve orienting people to the assessment instrument, sharing samples of the types of student work (if applicable) that were used to generate the data, and inviting faculty and staff to score samples of student work, so the numerical data has more immediate meaning for them.
2. Present the Data clearly, concisely and without bias
Data presentation should not only include some context for understanding the data, but it should also communicate the data in a relatively simple form that also avoids any immediate interpretation. If you have the potential to present the data to an audience rather than just in text, this can involve limiting the audience initially to ‘clarifying questions’ rather than more ‘probing questions’ that might suggest an interpretation of the data. Furthermore, the audience can be invited to ‘describe the data’ in ways that avoid interpretation but clarify patterns that can be observed and may be important. Sample sizes should always be provided as they will be important for later interpretation, and in many cases the focus should be on how many or what proportion of students achieved a particular learning outcome, rather than simply reporting means of scores which are less relevant in terms of how many of our students are learning.
3. Allow an inclusive group of stakeholders to draw measured, informed conclusions
For the purposes of evidence-based decision-making on a campus it is critical to bring as many of the appropriate stakeholders as possible into the conversation, share the data with them, and allow them to explore the possible implications of this data. In order for the data to be used effectively, certain ground rules should be in place. The stakeholders should be encouraged to accept that the data means something. Too often small sample sizes and imprecise assessment techniques are cited as a reason to discount assessment data. Stakeholders should be reminded that the goal of assessment is not to ‘prove’ something, but instead to ‘improve’ something. They should be encouraged to triangulate different data sources including their own professional experiences with students to draw inferences on what the data means, not about the quality of our students, but about the quality of teaching and learning on campus.
4. Record the implications of the data along with potential and in-progress responses.
Unfortunately, too many valuable conversations about assessment data, remain nothing more than conversations. They fail to yield any results in terms of actual changes to teaching and learning, not because the data has not been presented and interpreted, but because the ideas are not recorded and ultimately acted on. In many cases these conversations can reveal not only potential courses of action to address the assessment results, but in many cases the stakeholders will have already begun to implement changes to their courses that address the concerns in the data and should be built on by others. These in-progress responses along with projections for curricular and programmatic change based on the data must be carefully recorded and shared back with the stakeholders at later time periods for further reflection.
Next Steps
As you move through the rest of the module we will return to these 4 points. The first two will be addressed in the next section of the module that answers the question, “What are the range of ways to use assessment data?” In this next section we will look at how we can use benchmarks among other techniques to put the data in context, and how we can present the data most effectively. The final section of this module asks the question, “How can we move from ineffective uses of data to closing the loop?” In this section we will discuss approaches for effectively sharing data with the critical stakeholders in ways that allow for reasoned analysis and interpretation of the data. We will conclude by discussing how to effectively use the data to make decisions and document those decisions so that they can result in real changes.
Activity: Beginning a Data Use Plan
Throughout the upcoming sections of this module we will use the concept of an assessment plan that is also covered in the module on “Gathering Assessment Data.” That module discusses the process of identifying the learning goals and objectives, assessment questions, types and sources of data, and timelines and responsibilities for data collection, and developing a plan for utilizing data requires much of this same information, as well as important considerations with regard to the benchmarks and presentation format we are setting for data analysis, who our stakeholders are for the data, and the ways we might use the data to inform changes at our institution (Figure 1). While we could add these columns to our initial assessment plan, and our plan may have to be revised as we consider these issues, we envision data gathering and data use plans as two separate documents.
| What are the goal/objectives you are trying to achieve? | What are the questions you are trying to answer? | Source of data/method of data collection | Benchmarks/Standards and Data Presentation | Audience/ Stakeholders | Potential uses of the data |
|---|---|---|---|---|---|
One of the advantages of having the data use plan as its own document, is that as you actually carry out the plan, each of the last three columns can be replaced by new information so the table becomes your assessment report (Figure 2). Such a report would include the results of the assessment described and represented in terms of their relationship to the benchmarks and standards, details on the actual timing and audience for meetings to discuss the data, and the actual changes proposed and/or implemented in response to the data.
| What were the goal/objectives you were trying to achieve? | What were the questions you were trying to answer? | Source of data/method of data collection | Comparison of Results to Benchmarks/ Standards | Process of convening Audience/Stakeholders | Proposed and implemented changes |
|---|---|---|---|---|---|
For this activity, please focus your attention on the data use plan. If you have completed the assessment plan module, you can use the goals/objectives, questions and sources of data/methods of data collection you identified in that module. If you have yet to complete the module, you can reference sample assessment plans (example a, example b), or identify your own goals/objectives, questions, and sources of data/methods of data collection from your own campus work. For now, begin to complete the data use plan ignoring the benchmarks/standards and data presentation column.
| What are the goal/objectives you are trying to achieve? | What are the questions you are trying to answer? | Source of data/method of data collection | Benchmarks/Standards and Data Presentation | Audience/ Stakeholders | Potential uses of the data |
|---|---|---|---|---|---|
Final Reflection
After completing this activity, reflect on your final product by responding to the questions below. You can do this exercise through either individual reflective writing or discussion with a partner.
- While creating the final product, what audience/stakeholders did you focus on and why?
- Did you, or can you now imagine ways in which the data might be used at different levels by different audiences/stakeholders?
- For group dialog: Are there other potential changes as a result of the data that could be imagined but are not included?
Resources
Maki, P. L. (2010). Assessing for learning: Building a sustainable commitment across the institution. (2nd ed.). Sterling, VA: Stylus.
Suskie, L. S. (2009). Assessing student learning: A common sense guide. (2nd ed.). San Francisco, CA: Jossey-Bass.
Chapter 2: What are the range of ways to use assessment data?
Warm-Up Activity
As a first year student, Juan was upbeat and consistently expressed his intent to major in Biology. Last week, Juan emailed to ask for an academic advising appointment concerning the major. When he visited, Juan reflected on the challenge of his sophomore level genetics course. He was learning a lot, earning decent grades, but he was concerned that what he thought he learned about core, foundational concepts such as the cell divisions mitosis and meiosis and chromosome segregation was not ‘translating’ effectively in his genetics class. Juan asked if he could sit in on the Foundation class in order to review these core concepts. He also mentioned that he made an appointment with a BIO tutor and looked forward to working with the tutor. You agreed and supported his plan of action. At the end of the meeting, Juan hesitated and confided that he was also having trouble distinguishing between identical (sister chromatids) and similar chromosomes (homologs) in the context of this new course.
Juan’s predicament reflected a question that your program had been grappling with for a while: How effectively were students applying core concepts from their introductory Foundation courses to more specialized second year courses, such as the Department’s genetics course?
A year ago you decided to raise the question with your Department chair and asked if she thought the question should be placed on the Department’s agenda for next month’s meeting. Your chair responded that she thought the question was a good one and might prompt more questions about student learning in the major. She then asked you what you might do to engage the question before the next Department meeting and to be ready to share your thoughts, and possibly a plan.
Much to your relief, your department colleagues appreciated your question. They shared your concern about student learning. Several colleagues commented that they routinely think about how students apply core, foundational concepts from one course to another, but were not sure about effective ways to address the issue. One colleague admitted that her concern was often framed as a complaint about student preparedness and student persistence. Another colleague remarked that they thought the students’ capstone projects are comprehensive and an index of student learning in the major. You shared with your colleagues that your plan for next semester was to take a small step forward in researching how student learning transfers from course to course: In your section, you planned to use a CAT (Classroom Assessment Technique) borrowed from Angelo and Cross called “the background knowledge probe.” Your plan would involve a pre-test that would be given during the first weeks of the semester that asked students to classify pictures that were representative of particular phases of mitosis and meiosis so you could assess their prior understanding of two foundational course concepts. The Department reached a quick consensus that this plan should be rolled out in each of the twenty sections of the Foundation 111 course. One colleague then stressed that these same questions should be included as common questions on the BIO 111 final exam. The goal here was to mine assessment data from all students across multiple sections of the course. Results from the exam questions would be de-identified, aggregated, and submitted to the Department Chair. Faculty who taught the course were now looking to you to move the plan forward.
By the time Juan had taken BIO 111, faculty had designed and implemented a pre-test, the CAT background knowledge probe, which would be given in each section of the course. They then met to discuss the results. Approximately, 54% of students identified correctly the pictures representing meiosis and approximately 21% identified correctly the pictures representing mitosis. Some faculty were surprised at the results of the CAT; others remarked that CAT confirmed what they suspected. At the end of the semester, the final examination results on the common question were: 80% of students identified the processes of meiosis and 34% identified the processes of mitosis. The results engaged faculty in several conversations about teaching these foundational concepts, including the idea of a flipped classroom using a modeling approach. Next year’s course assessment plan would involve the same “background knowledge probe” and the same common final examination questions. Out of twenty sections of the course, eight faculty agreed to design a flipped classroom and modeling approach to help students learn about these two foundational course concepts.
Case Study Questions:
- Do you think the CAT was a useful, manageable first step in this particular assessment project?
- How might the results be useful and offer actionable data at the course level?
- After reviewing the results of the embedded questions on the final exam, how might these results help faculty determine standards or benchmarks for student learning, that is, how might the results help faculty to determine the percentage of students that should demonstrate competency regarding these core concepts across multiple sections of this introductory biology course?
- How can the results from the final examination offer additional, practical data that would help faculty rethink teaching methods and improve student learning and retention regarding these core concepts in order to better prepare students for next level courses?
- Could such a first step facilitate the process of curriculum mapping within the Department? How exactly?
- Could such a first step help with curriculum coherence so that students apply foundational disciplinary concepts more readily and effectively in the next level courses?
- Using the table from the Gathering Data module, use the case study individually or in teams of three to map this emerging assessment plan?
Here it may also be useful to review an overview of the table from the module Gathering Data:
| What are the goals/outcomes you are trying to achieve? | What are the questions you are trying to answer? | Source of Data | Effective Potential Use at the Department Level/ Audience/ Stakeholders | Potential Effective Use at the Program Level/ Audience/ Stakeholders | Potential Effective Use for General Education Curriculum | Potential Effective Use for Institutional Effectiveness Audience/ Stakeholders |
|---|---|---|---|---|---|---|
Setting Benchmarks
Reflecting on the example of Juan and his fellow Biology students, if Juan, like many of his peers, correctly identified the pictures of meiosis on the pre-test and final, but failed to identify the pictures of mitosis on either the pre-test or final, what does that tell us about his learning in the course? Furthermore, is it a success to improve from 54% to 80% correctly identifying meiosis by the end of the course? What about improving from 21% to 34% correctly identifying mitosis? These questions illustrate the critical importance of setting benchmarks or standards for the purposes of using assessment data. These benchmarks help us to figure our what our results mean in the context of student learning. If we know there are areas in which students are meeting our benchmarks, and other areas in which they are not, we can focus our time and attention on the areas of concern. In this way benchmarks allow people to narrow down assessment results to something reasonable on which to work. In addition, this narrowing of focus can facilitate the process of presenting the data. By puling out and highlighting assessment results below certain benchmark we can make the data manageable for a broader audience.
Types of Benchmarks
There are a variety of approaches to setting benchmarks. Linda Suskie (2009) identified 10 kinds of benchmarks or standards that can be roughly grouped into 3 categories: Competency-based standards, Comparative benchmarks, and a varied group of other approaches that generally take into account measurements of growth or relative growth.
1. Competency-based standards
- Competency-based standards, also called criterion-referenced benchmarks, involve comparing the results of assessment to some pre-defined standard of success. For instance, in the case of Juan and his peers, if it was determined in advance that an acceptable level of performance on the question for the final exam would be to achieve 80% of students correctly answering the question, then the benchmark would be met for the Meiosis, but not for Mitosis. Competency-based standards vary in the ways in which the standards are set:
- Local Standards: Local standards compare the assessment results to a benchmark established by individuals from the institution, including potentially the course instructor(s), program faculty, or a broader group of institutional representatives. The advantages of local standards are that they give the benchmark meaning for those conducting the data analysis and responding with potential changes to courses, programs or policies, because they were involved in setting the benchmark themselves. One potential disadvantage of local standards, is that the audiences examining the data must trust the judgment of the people who set the standards. Because there is potential subjectivity to the level of the standard, this may be particularly problematic, if there are also questions about subjectivity in the data itself, such as indirect measures of student learning.
- External standards: External standards compare assessment data against a benchmark established by stakeholders outside of the institution. Common examples of external standards include the passing scores for State or National tests such as the NCLEX for nursing students and the PRAXIS used for teacher licensure in some states. In each case a score has been set by a disciplinary or professional organization to determine whether students have met the standard. In such instances, National accrediting organizations may also establish benchmarks for the percentage of students in a program that must meet the standard in order for the program to retain its accreditation. Such external standards can simplify the assessment process for an institution by removing the need to set the benchmark internally. However, faculty and staff may not always embrace benchmarks that they have not established themselves.
2. Comparative benchmarks
- Comparative benchmarks, also called normative or norm-referenced benchmarks, compare assessment results to the results from other students assessed in the same manner. Students assessed with the same assessment instruments and under the same or similar conditions can provide a reference point against which to compare the assessment results in question. For instance, if we knew how some other group of students did on the same mitosis and meiosis questions posed to Juan, we could use that data to establish our benchmark. The sources of comparison data can include data collected at the same institution or other institutions, as well as data collected in prior years. Furthermore, comparisons may be made with all students based only on the results of the assessment, only with the best-performing students, and in some cases as a function of the investment by students required to produce the assessment results.
- Internal Peer Benchmarks: Internal Peer benchmarks compare the assessment results of a group of students from your institution to a second group from the same institution. For instance, if Juan and his classmates were part of a special section of Bio 111 which implemented a flipped classroom approach, we might compare their assessment on the final exam to the other sections of Bio 111 to see whether there were any differences. Peer benchmarks allow us to determine if a particular group of students is performing as well as, worse or better than other students at the institution. Particularly in cases where we have a common assessment across the entire institution, it can be useful to disaggregate the data by program to examine if students in particular programs are more or less successful with different aspects of the assessment.
- External Peer Benchmarks: External Peer benchmarks compare the assessment results of a group of students from your institution to a second group from one or more other institutions. The average performance of similar students at similar institutions can be compared to the performance on the assessment of students at your institution to get an idea of how your student outcomes compare. There are a variety of challenges to using external peer benchmarks, including the fact that it may be difficult to get appropriate comparable data. This data may not be available in general, or it may not be available for institutions with missions, programs, and/or students that are comparable to your own. This means that one of the most critical steps in using external peer benchmarks is to identify appropriate peers. Some instruments like the National Survey of Student Engagement (NSSE) allow you to identify more than one potential peer group for comparison.
- Best-Practices Benchmarks: While it is often desirable to compare your students against similar students at similar institutions, in some cases it may be desirable to compare your assessment results against those from an institution or institutions that are identified as having some of the highest levels of performance on the same assessment instrument. Best Practice benchmarks compare your results against the best of your peers. These kinds of aspirational comparisons can be very motivating as faculty and staff are encouraged to strive to make their programs among the best. However, such comparisons can also be frustrating and disenchantment as it takes time to achieve real change, and often the conditions that create excellence in one institution are very difficult to replicate in your institution.
- Historical Trends Benchmarks: Historical Trends benchmarks compare students not against their current peers at your own or another institution, but against peers in prior years of assessment, particularly those from your own institution. These comparisons can be valuable because they may allow us to detect the positive or negative effects of changes at the institution over time. However, these comparisons may become less and less relevant the more changes that there are between the experiences of groups of students over time. Differences from year to year in assessment results can reflect not only those changes intentionally brought about by the institution, but also changes in the student body and student experiences that are outside of the control of the institution.
- Productivity Benchmarks: Productivity benchmarks compare student assessments within or between institutions in terms of the assessment results adjusted by some estimate of the financial investment that yielded those results. For instance, Juan and his peers at his institution may have generated their assessment results while supported by full-time faculty teaching their laboratory sections. In contrast students at another institution might be assessed in the same way, but with graduate students teaching the lab sections. Productivity benchmarks represent an effort to compare how these relative investments impact student learning. While the increased emphasis on controlling the costs of higher education has led to efforts to examine productivity benchmarks, most programs still endeavor to maximize student learning, without running the risk of adopting policies or procedures that yield less overall learning but at a savings.
Measuring Growth
While the Comparative benchmarks listed above compare assessments students within and between institutions, some forms of benchmarks are intended primarily to compare students to themselves in some way. We’ve categorized these as growth benchmarks, because unlike the other comparisons they generally require knowing something else about the student besides how they performed on one single assessment. For instance, in the case of Juan, we know not only how he did on the final exam for BIO 111 but also how he did on the pre-test.
- Value-Added Benchmarks: Value added, also known as growth, change, longitudinal, or improvement, benchmarks compare one assessment of a student to the same or a similar assessment after an educational experience. Juan’s pre-test and final exam provide an opportunity for setting a value-added benchmark. However, the example of Juan and his peers also raises some of the concerns related to value-added benchmarks. For instance, while the department may be happy that success on the mitosis identification increased significantly from the pre-test to the post-test, if they focus on that alone, they might ignore the fact that it is still undesirable to have only 34% of the students correctly identifying mitosis. Furthermore, in some cases, particularly for broader skills that we assess, student growth may have nothing to do with the courses we are offering and everything to do with the rest of their processes of development and maturation. Finally, there are challenges to successfully measuring students prior to their educational experience including lack of student motivation, lack of student availability for the pre-assessment, and the limits of our ability to measure growth from either very high or very variable initial scores.
- Capability Benchmarks: Capability benchmarks represent an effort to compare student assessment results against what they are really capable of doing. This is even more challenging to assess than value added benchmarks, as it is very difficult to have a true assessment of what a student is capable of achieving. However, it is worthwhile to consider the possibility that within some of our assessments we could adjust those assessments on a student-by-student basis based on some other estimate of their potential. For instance, the student who is and has consistently been otherwise highly achieving who still fails to recognize meiosis on the final may be looked at differently than the student who is successful in spite of otherwise weak indications of capabilities from other assessments.
- Strengths and Weaknesses Perspective: While it may be valuable in many cases to compare students to themselves using the same assessment to measure growth, or to compare their performance on an assessment to an estimate of their overall capability from other related assessments, in other cases it can be very useful to compare students to themselves in terms of the assessment of distinct skills or criteria. If we can measure student performance on distinct skills or sub-skills, it can be possible to identify relative areas of strengths and weakness. By doing this we can focus our efforts on improving student performance in those areas where they are weakest. However, this assumes that we view each of these areas as equally important and equally amenable to teaching. For instance, it is possible that some areas are naturally weaker in most students, and potentially most resistant to improvement. While this should not prevent us from making continued efforts in that area, by benchmarking that area against others, we may perceive little improvement for our efforts, and become frustrated if we only look at the assessment of this area relative to the other areas rather than against some other benchmark.
Activity: Choosing Types of Benchmarks
A quick review of the 10 types of benchmarks reveals that in most cases the choice of a type of benchmark should be made prior to collecting any assessment data because different benchmarks either require that you use an assessment instrument that allows you to access additional information/data in order to establish the benchmark, or requires you to collect additional information/data in order to establish the benchmark. Take a moment to review each type of benchmark and complete the table of strengths, weaknesses and any other considerations.
| Strengths | Weaknesses | Other considerations | |
|---|---|---|---|
| Local Standards | |||
| External Standards | |||
| Internal Peer Benchmarks | |||
| External Peer Benchmarks | |||
| Best Practices Benchmarks | |||
| Historical Trends Benchmarks | |||
| Productivity Benchmarks | |||
| Value-added benchmarks | |||
| Capability benchmarks |
Identifying the Information to Analyze and Present
While it is important to decide what types of benchmarks to use when analyzing data and ultimately presenting it to stakeholders, it is also critical to identify the types of information you are going to use to set your benchmarks and what to share with the stakeholders. Some of the range of information available to you will be dictated by the instruments you are using to gather data, but in all cases you will have important decisions to make about what information to use when analyzing the data and how much of it to share when attempting to make a clear, concise presentation. Considerations include how to present any quantitative values, whether and how to incorporate information about the variation in the data or shape of the distribution, how to characterize the sampling, instrument data, and finally the data analysis itself.
This overview does not attempt to explain data analysis and presentation comprehensively. Instead the following represents and effort to identify the major concerns for sharing data with faculty and staff in an academic setting. Furthermore, by reviewing the range of possible ways to present assessment data, you may consider some less frequently used possibilities.
Values
Using and presenting values can be a challenging part of the assessment process. Not all faculty and staff feel comfortable interpreting values, and it is critical to place the values in context for yourself and the audience. How you accomplish this may vary depending on the nature of the data you are presenting.
Continuous
In some instances, you may have continuous data about aspects of student learning. This might include exam scores, or student grades expressed on a continuous scale. While these scores are generally bounded by a lower limit of 0 and an upper limit such as a total number of possible points, there is often a sufficient range of possible scores to consider the data continuous, and suggest the need to provide some guidance for interpreting the data through benchmarks.
Continuous data can be represented effectively using the mean score for the population of interest and as discussed previously this can be presented relative to a benchmark involving a pre-defined level of competency, or in comparison to the mean from another population of interest. If the data is presented numerically in a table such as when there are multiple populations or lines of data to present, cells of data can be color coded or bolded to highlight when the mean exceeds or falls below the benchmark (see Table 1 below for a general example of this using percentages even though statistical analysis was done using means), or if the data is presented in a bar chart, a competency benchmark can be represented as a horizontal line, or different bars can be used to represent the different populations when using a comparative benchmark (Figure 1).
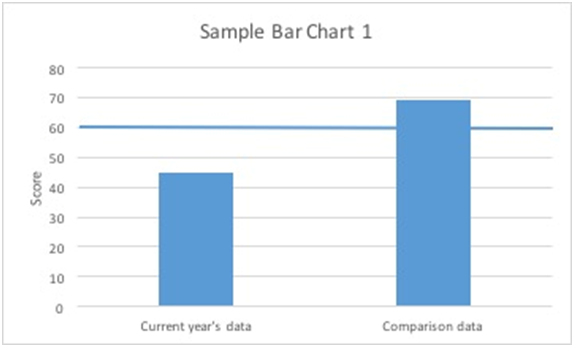
Figure 1: Sample Bar Chart 1
Discrete
Assessment data more often falls into discrete categories, such as the different scores on a rubric, or the different responses students can give using the Likert Scale on a survey. While this data is sometimes represented using the mean for the population of interest as it would be for continuous data, this is not always the most appropriate or informative way to represent this data. It is worth looking closely at the data to determine if there might be a more informative way to represent the data. For instance, given rubric scores or Likert scale responses with only 5 possible categories, the mode, representing the most commonly selected category, or the median representing the midpoint of the scores may be much more relevant pieces of information than the mean.
For instance, if in a sample of 100, there were 50 1s, 20 2s, 10 3s, 10 4s and 10 5s, the mode of 1 would capture the fact that there were so many 1s, and the median of 1.5 would also provide a good sense of this, while the mean of 2.01 might give a misleading sense that in general responses tended towards 2s. As with continuous data, these results can be presented in tables with colors or formatting indicating the relationship between mean or median and the benchmark. Continuous data can also be converted to discrete data, if it helps in providing a concise summary of the data.
For instance, while the mean or median of both continuous and discrete data can be presented in a bar graph as described above, discrete data with 5 or fewer categories, or continuous data grouped into such categories, can be relatively succinctly represented using a frequency histogram with bars representing the frequency with which each category was selected. Imagining our example above, bars of height 50, 22, 12, 9 and 7 for each category 1-5, with a vertical line representing a competency-based or comparative benchmark, or even a second histogram representing a comparative benchmark, would provide a much more comprehensive picture of the data than mean median or mode (Figure 2).
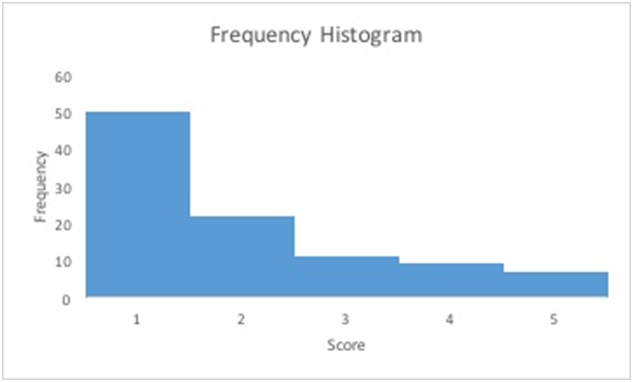
Figure 2: Sample Frequency Histogram
Percentage
While a frequency histogram provides the benefit of preserving the actual number of students in each discrete category, it may be preferable to convert from frequencies to percentages for comparing different groups of students with different total numbers. Percentages are also useful because they may best represent our goals in terms of student competency. We may not be as interested in the total number of students scoring a 3, 4 or 5, as we are in determining whether very few of our students (perhaps less than 10-20%) more of our students (over 50%) or most of our students (perhaps more than 80-90%) score a 3, 4 or 5. Finally, for binary data, in which there are only two categories, using percentages can simplify our presentation as we can present only the percentage in one of the two categories, because the audience can calculate the other category themselves by simply subtracting from 100%.
While pie charts are an effective way to represent percentage data, particularly when we want to preserve more than two categories, lumping categories together to create binary categories, like all those students responding/scoring a 4 or a 5 can allow you to present more data, in a table format, including potential benchmarks, and bolding to indicate deviations from the benchmarks as with the NSSE data below (Table 1). In this example a table format allows presentation of multiple years of data to demonstrate consistent trends over time in deviations from the National benchmarks versus deviations that only occurred in the most recent NSSE administration.
Table 1: NSSE 2004-2012 percentage responses by freshmen (FR) and seniors (SR) of 3 or 4 to the prompt – In your experience at your institution during the current school year, about how often have you done each of the following? 1 = never, 2 = sometimes, 3 = often, 4 = very often. Bold represents instances in which the mean response was significantly below one of the institutional comparison groups for that year, and symbols adjacent to 2012 comparison group percentages indicate significance level (p) for the deviation in 2012: – 0.05, — 0.01, — 0.005.
Table 1: Total Breakdown of NSSE Data

Variation
To the extent that you summarize your data using values such as the mean, median, mode, or percentage, and represent them in tables or figures, you will want to consider how best to share with your audience the underlying variation in the data that is obscured by these summary values.
Range
For data that could potentially occur on a broad continuum of values like continuous data or percentages, it may be worth considering presenting the range of values to the audience. For instance using the NSSE percentage data in Table 1, you might even further summarize the data on senior responses to how often they worked on a paper or project that required integrating ideas or information from various sources, but include the range for reference: “Between 79 and 85% of seniors reported often or very often working on a paper or project that required integrating ideas or information from various sources, representing significantly less frequency than their peers from at least one of the comparison groups in every year they were surveyed.” In some cases range may also be useful to represent graphically, but because the range may include extreme outliers, it is often helpful to include statistics that represent the range within which most of the data falls.
Interquartile range
This represents one way to illustrate to your audience the range in which most of the data falls. Just as the median represents the middle value in a set of values with half of the values above it and ½ below it, the interquartile range indicates the range from the value between the lowest ¼ of the data, and the other ¾ of the data and the value between the highest ¼ of the data and the other ¾ of the data. If we go back to our sample of 100 scores ranging from 1 to 5 illustrated in Figure 2, the median was 1.5 because 50 values were at 1 or lower (although there were none lower than 1) and 50 were at 2 or higher. Similarly our interquartile range would be from a low of 1 (since all 50 of the lowest values were a 1), to a high of 3, since only 72 values fell below 3 (in other words the 75th and 76th highest values were each 3). A box and whiskers plot can be used to effectively illustrate the range, interquartile range, and median. Figure 3 presents examples of two box and whisker plots. Plot 1 represents the data discussed above, in which the lowest value of both the overall range and interquartile range are at 1. Plot 2 represents the same overall range of values from 1-5, but in which scores were evenly distributed with 20 students receiving each score. You can see how that is reflected in the shape of the box and whiskers plot.
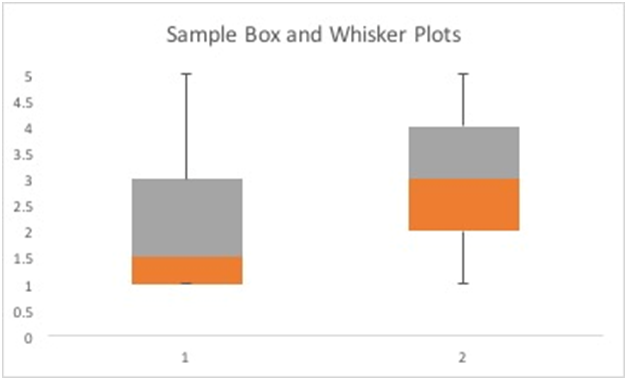
Figure 3: Sample Box and Whiskers Plot
Variation, Standard Error and Confidence Intervals
Just as the interquartile range provides a better sense than the overall range of the range of values within which most of the data falls, ‘errors’ or ‘confidence intervals’ around the mean can also indicate the level of variation for most of the data. The starting point for any of these calculations is the variance, the average of the deviation or ‘error’ of the data from the mean. This is calculated by first calculating the mean, then subtracting each data (n1, n2, n3 . . . etc.) point from the mean, squaring the resulting values so they are all positive, and then summing them and dividing by the overall sample size (n) to get their average. However, since the unit associated with the variance is the unit of measurement squared, often we take the square root of the variance, a number referred to as the standard deviation. While this is a reasonable way to express the variation of data relative to the calculated sample mean, in those cases in which the data represents a sample from larger overall population, we are even more concerned with the standard error of the mean an estimate of how much our sample mean is likely to deviate from the true mean of the overall population sampled. In other words if we resampled multiple times, we might get a different mean for each sample we took, and the standard deviation of those means from the actual mean, is estimated by the standard error of the mean or standard error, the standard deviation divided by the square root of the sample size (n). This relationship only holds up if the data is normally distributed, a property of our data set we will discuss later, but in the case of such a normal distribution, we can say something not only about how variable the sample is, but also the range of values within which the true mean of the underlying population is likely to fall. For a normal distribution of possible sample means, approximately 68% of them would occur within one standard error above or below the population mean (standard deviation of the mean). Therefore, when we use error bars on a figure to represent the standard error, there will be a 68% probability that it will encompass the true value of the population mean (Figure 4).
For normally distributed data, we can use this relationship between the standard error and the probability the mean will fall in a certain range of values to calculate confidence intervals, as 95% of the time the mean should fall in a range 1.96 x the standard error above or below the sample mean. In such cases, when error bars of comparison groups either overlap or don’t or when a confidence interval overlaps with a benchmark, you are visually portraying for your audience how likely it is that the true mean of your population sampled is really different from the benchmark comparison. The choice of a confidence interval or standard error bar has important implications for the ways in which the data might be interpreted. In general, you are likely to apply a significance level (p value) of 0.05 as your guideline for determining if your data is statistically different or statistically indistinguishable from your benchmark. Provided that is the case, a 95% confidence interval can be particularly useful when comparing the data to a set numerical benchmark such as that represented by the horizontal line on the figure below (Figure 4). If the error bars on that figure represent 95% confidence intervals, then the current year’s mean falls significantly below the benchmark at a significance level of 0.05 while the comparison data does not, as indicated by lack of overlap and overlap between the error bars and the benchmark line respectively. If the error bars represented standard error, you could not draw the same conclusion. On the other hand, because standard error represents approximately ½ of the 95% confidence interval, it can be more effectively used to compare two calculated means like the two bars representing the current year’s data and comparison data. If the error bars for the two means were 95% confidence intervals, in order to determine whether the means would be considered significantly different at a significance level of 0.05, we would have to estimate whether the error bars overlap by less than ½ of their length. While it looks like they don’t in this instance, that can sometimes be hard to judge visually. In contrast, if we present the standard error, then provided they don’t overlap at all, we can assume they would be considered significantly different. In the case below, if the error bars represent standard error, we would infer no significant difference between our current year’s data and the comparison data because there is a small overlap between the lower extreme of the comparison data error and the upper extreme of the current year’s data.
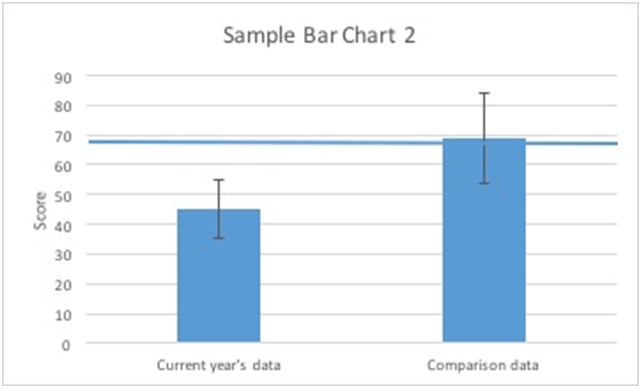
Figure 4: Sample Bar Chart 2
Please bear in mind as noted above, that you can only draw these conclusions about the statistical significance of your comparisons, if you are confident that your sample is from a population with a relatively normal distribution of data. Therefore, the decision as to whether to represent your data using means and error bars or confidence intervals, or as box and whiskers plots of median, range, and interquartile range, or as a histogram, should take into account the distribution of your data.
Distribution
The pattern with which data is distributed across the range of values is important not only in terms of determining an approach to presenting the data, but because at times it may be one of the most important pieces of information about the data to share with your audience. When we are considering student learning, we should arguably be just as concerned about how our best and worst students are doing as about how our average students are doing, and how many of our students fall into each of these areas of the range. We can roughly characterize the distribution of our data by categorizing it as relatively normal, bimodal, or skewed.
Normal
A normal distribution, is arguably the kind with which you have the most day to day experience. For many variables in life, such as human height, we note rare extremes at one end of the range or the other, with most of the data points falling somewhere in between these extremes, clustered near the mean. As noted above, you are assuming a reasonably normal distribution of data when you apply parametric statistics such as when constructing a confidence interval for a sample mean. However, it is worth noting in many cases you won’t know the true distribution of the population, and can only infer it from the distribution of the sample data you have collected. You must essentially ask yourself, does the sample data look normal enough (consider Figure 5) to suggest a reasonably normal population distribution.
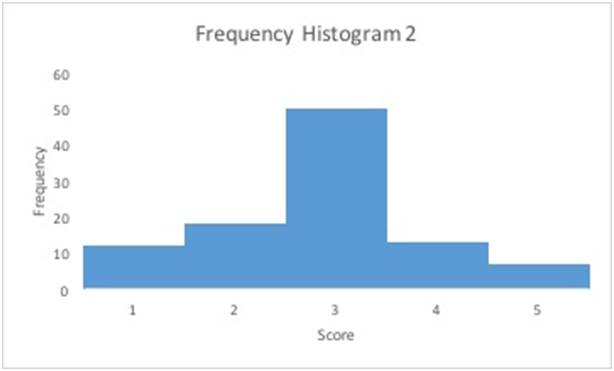
Figure 5: Frequency Histogram 2 – representing a sample that might have come from a reasonably normally distributed population (mean = 2.85).
Bimodal
While many measurements in the world around us tend to follow a normal distribution, anyone with experience in the classroom has likely experienced deviations from this type of distribution in student grades from time to time. One other common distribution you might have experienced occurs when you have a group of very high performing students, another group of very low performing students and very few students in between. This represents a bimodal distribution. If your data follows such a distribution, it is critical to present it and share it as such using a histogram like the one below (Figure 6). The mean can be highly misleading as many more students are underperforming than the example above (Figure 5), but they have exactly the same mean score. Neither a bar chart of this data, or a box and whiskers plot can adequately capture the shape of this distribution the way a histogram can.
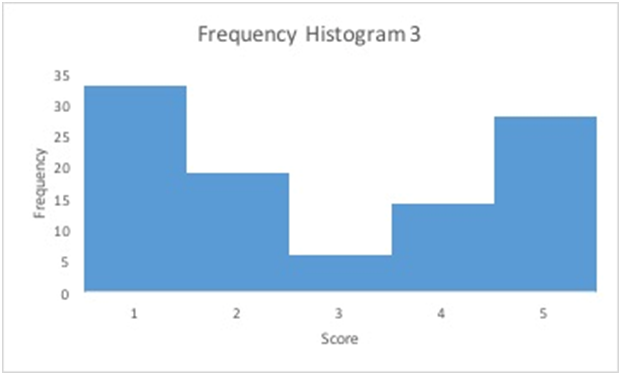
Figure 6: Frequency Histogram 3 – representing a bimodal distribution (mean =2.85)
Skewed
You have already seen an example of a skewed distribution of data on the first page of this content “Identifying the Information to Analyze and Present 1 of 4” (Figure 2), which occurs when most of the data points cluster towards one end of the data range. As noted previously, this can also cause the mean to be a misleading descriptor of the population, with many more individuals scoring towards one extreme of the range, than the mean alone would suggest. While a bar chart would not be an appropriate way to represent the data, and a histogram would accurately capture the distribution, a box and whiskers plot can also provide information about the degree to which the distribution is skewed (Identifying the Information to Analyze and Present 2 of 4 Figure 3).
Data Analysis
You have already seen a few ways in which your presentation can provide some information that helps with the analysis of the data. Benchmarks for comparison in tables or figures facilitate the analysis of data by your audience. Error bars and 95% confidence intervals on figures provide information about statistical analysis, of the data, and further information can be provided in tables or figure legends. However, assessment data is not always amenable to conventional statistical analysis (parametric statistics), and even when it is, statistical analysis may not be as useful or meaningful, as other approaches to comparative analysis that rely on comparing inputs, experiences and outputs, and/or multiple lines of evidence to better understand and explain what is occurring in the educational setting.
Statistical Analysis
As noted above, traditional parametric statistics assume an underlying population that is reasonably normally distributed with regard to the measurement that is being made. For a number of reasons, this assumption may often be violated for assessment data. One reason is that the measurements we make are done so with instruments (surveys, rubrics, etc.) that often constrain the range of responses possible (for instance to a Likert scale or rubric score) in ways that could contribute to deviations from a normal distribution, like the skewed and bimodal distributions discussed previously, or even a relatively uniform distribution in which a roughly equal number of data points occur for each of the different possible scores. There is evidence that scorers tend towards middle scores on such scales, favoring a more normal distribution. However, there also remains the possibility that the educational interventions we are implementing are more likely to generate a positively skewed distribution if the intervention is effective, bringing all students up to a high level of mastery, and negatively skewed or bimodal when the intervention is ineffective, either holding back the learning of most students or only helping a subset at the expense of the others.
While parametric statistical analysis may not always be appropriate based on the nature of the data, there are a number of nonparametric statistical approaches that can also be used. Neither, the parametric nor the nonparametric approaches will be discussed here, and you should consult with a statistician, or develop your own personal expertise, if you are interested in determining how you might approach these analyses. However, just as important as determining what statistical test to use, will be determining whether to use one at all, and how to present the data if a statistical test is used. As noted previously, the ultimate result of a statistical test used to compare a sample to a fixed benchmark or a sample to another comparison group will generally be a p value, representing the probability that the underlying population statistic (usually the mean for parametric statistics, but other statistics for nonparametric statistics) deviates from the benchmark or comparison group. This p value is usually compared to a standard of 0.05 (5% probability) with the presumption that if the value is less than 0.05, the chances that the two values (from our population of interest and its comparison) are sufficiently unlikely to be the same, that we can conclude there is a real and significant difference between the underlying population values we have estimated with our statistics. Such a result could lead you to conclude for instance that students in your program of study are significantly less likely to display effective writing skills than students from another program of study.
There are 4 primary cautions to keep in mind when utilizing such data to draw conclusions: The issues of small sample sizes, multiple comparisons, the distinction between statistically significant differences and ‘meaningful’ differences, and your tolerance for Type I and Type II errors.
- Small sample sizes: Statistical tests in general are designed to account for the sample size when calculating a p-value, with the understanding that a smaller sample size provides less likelihood of detecting a statistically significant difference. The potential for a sample of a particular size to detect a significant difference is referred to as its Power, and smaller samples have lower power than larger samples. It is possible in the process of experimental design to estimate the power for particular sample sizes and select a sample with sufficient power. However, we do not always have that luxury with assessment data, particularly at the course level, when a class size might be as small as 10 or 20 students. Even when it is possible to aggregate data across multiple classes, doing so might sacrifice some of the interesting differences that emerge between classes. When sample sizes are small, you have a choice to make between determining the statistical significance of the data with the understanding that it is unlikely to be significant, and refraining from calculating or sharing significance data. The risk of presenting results as non-significant when there is low power to detect a significant difference due to sample size, is that it may blind your audience to interesting patterns that emerge from the data. In those cases you may choose instead to caution the audience about drawing conclusions from small sample sizes, but to engage them in a discussion of what the data could suggest without dwelling on its lack of statistical significance.
- Multiple Comparison: By setting a p-value of 0.05 as our standard for establishing the significance of a statistical difference we are accepting up to a 5% chance that our estimates of the population statistic from our sample will appear different than the statistic to which we are comparing it, just by chance. As we do this over and over again for multiple sets of data, or for instance, for multiple questions on a survey, the likelihood increases overall, that for at least one of these comparisons, an error of this sort will occur. For instance, if you have 20 questions on a survey of 100 students and each one is significantly different from the benchmark of last year’s 100 students at a p of exactly 0.05 (1 in 20), it is reasonably likely that one of those 20 detected differences will have occurred just by chance, with no real differences in the potential responses from the whole population for this year from those for last year. There are statistical techniques to account for this including adjusting the p value cutoff accordingly. However, another possibility to consider is avoiding running all of these multiple statistical comparisons and focusing on a discussion of the data itself first with your audience, reserving the possibility to delve deeper with statistical analysis after interesting trends have been identified.
- Significant versus Meaningful differences: For a given sample size, larger differences between the sample statistic and the comparison statistic will yield smaller p values, and increase the likelihood the p value will be below the cutoff of 0.05. However, as the sample size increases, the power increases and relatively smaller differences can be detected as statistically significant. For very large sample sizes, including if you are comparing your institutional data to a very large comparison group like all of the NSSE data, this raises the question as to when is a significant difference really not a meaningful difference. Consider the table we looked at before (Table 1). When examining the extent to which Seniors felt their courses “Included diverse perspectives (different races, religions, genders, political beliefs, etc.) in class discussions or writing assignments,” 60% agreed or strongly agreed that they did, while 63% of seniors from New England 4 year public institutions also agreed that they did. When the mean scores were compared they were found to be significantly different at a p of 0.05. however, this level of difference may not be meaningful enough to merit the same attention as some of the other findings, particularly when they only emerged in one year of the survey.
Table 1: NSSE 2004-2012 percentage responses by freshmen (FR) and seniors (SR) of 3 or 4 to the prompt – In your experience at your institution during the current school year, about how often have you done each of the following? 1 = never, 2 = sometimes, 3 = often, 4 = very often. Bold represents instances in which the mean response was significantly below one of the institutional comparison groups for that year, and symbols adjacent to 2012 comparison group percentages indicate significance level (p) for the deviation in 2012: – 0.05, — 0.01, — 0.005.
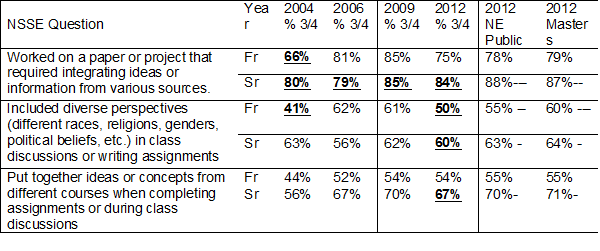
Table 1: Total Breakdown of NSSE Data
- Tolerance for Type I and Type II errors: The standard of setting 0.05 as the cutoff below which you conclude there is significance to the difference detected by the statistical test, is equivalent to suggesting you will not tolerate any more than a 5% chance that you have concluded there is a difference when there is actually no difference. In those cases for which there actually is no difference but you have concluded there is, you have committed a Type I error. For instance, in the example above when the sample responses to one of the 20 questions on a survey are deemed statistically different from the sample responses on the prior year’s survey just by chance, even though there were no differences in the underlying populations, you accidentally committed a Type I error. The other type of error that can occur, a Type II error, occurs when there is a real difference in the underlying populations but you fail to detect it. This is what can occur when your sample size is too small to detect the difference. While the cutoff for the p value controls the chances of a Type I error, the more stringent you are in that regard, the greater the chances of committing a Type II error. When using assessment data for improvement in your programs it is critical to consider what the consequences for each type of error represent, and whether the standard p value of 0.05 is appropriate for your purposes. For instance, if you are conservative and ignore differences that do not yield p values less than 0.05, and as a result, fail to make any changes in response to the data, you run the risk of missing opportunities that could have improved learning. On the other hand, if you jump at every difference regardless of the p value, and the size of the difference, you may overcommit resources to meaningless efforts. In the end, you should remember, that the p value is just an aid to you and your colleagues’ professional judgment and ultimately the value of assessment is only when you wed the data with your insight into campus and classroom experiences. Therefore, you should consider carefully when and how to calculate and share p-values and conclude significance or lack of significance as it may not always aid discussions as much as a careful review of the data itself.
Multiple lines of evidence – Inputs, Experiences and Outputs
Bringing together multiple lines of evidence is a critical step in conducting a careful review of the data. Looking at Table I above, while all of the statistically significant results are highlighted in bold, they only serve to reveal patterns when compared to each other. For instance, consistently lower levels of reporting by seniors that they “worked on a paper or project that required integrating ideas or information from various sources,” across all 4 administrations of the NSSE suggest something much more meaningful than a small difference in Seniors only in 2012 in terms of having “put together ideas or concepts from different courses when completing assignments or during class discussion.” In fact, the pattern of significantly lower levels of senior responses to all three questions in only 2012 might suggest the smaller differences were more a function of this particular sample of the seniors than a true characteristic of the curriculum. These types of patterns can be investigated further with access to other forms of data, and with careful consideration of the Inputs, Experiences and Outputs the data can represent. Structuring a data collection plan to insure data on Inputs, Experiences and Outputs is discussed in detail in the Gathering Data module. However, in short, this involves identifying what we know about the students prior to their educational experience (Inputs), the nature of the educational experience (Experiences), and what we know about students after the educational experience (Outputs). For instance, the NSSE data above (Table I) gives you information about the educational experience for freshmen and seniors. This data might be combined with data from writing samples scored with a rubric for freshmen and seniors to see how they progress in the use of sources in their writing. If little improvement is observed from the Input (use of sources in freshman writing) to the output (use of sources in senior writing), then this coupled with the experience of seniors consistently experiencing fewer papers or projects requiring “integrating ideas or information from various sources” might spark a wider discussion amongst your audience about how they are supporting these skills in students. In terms of data analysis, this process of bringing together multiple lines of evidence, representing inputs, experiences and outputs for your audience, may be much more critical than the process of statistical analysis.
- It is critical to consider that the standards of statistical analysis are established to maintain a common set of expectations in the literature for how we ‘prove’ something to be true. In contrast, as you approach efforts to use assessment data to inform institutional change, you and your audience will be much more focused on how to ‘improve’ something, a cycle of inquiry that demands thoughtful collective judgment given the best data available even if that data is not perfect. Do not let the perfect be the enemy of the good.
Final Considerations
As you consider how to communicate with your audience about data in a way that makes it meaningful and useful for them, it is critical to be open honest and forthright about any and all limitations of the data, while promoting the message that both the data and the process of engaging with it have value for informing their decisions. Be clear on all of the considerations with the data, which are discussed in the Gathering Data module. This includes sharing with your audience the sampling methodology, such as random, stratified random or comprehensive sampling, and what can be said about the validity and reliability of the data.
Activity: Building on Your Data Use Plan
In the initial section of this module you continued work on an assessment plan that is also covered in the module on “Gathering Assessment Data.” Either drawing from that module or independent of it, you identified a set of learning goals and objectives, assessment questions, types and sources of data for your data use plan. You also added who your stakeholders were for the data, and the ways you might use the data to inform changes at your institution.
For this activity, please focus your attention on the data use plan again. In the last assignment you were asked to identify strengths and weaknesses to different approaches to bench-marking. For this activity you will be filling in one more column to identify the benchmarks/standards you will be using for each source of data/method of data collection. In addition, you will use the information you just reviewed to propose how the data will be presented relative to the benchmarks provided. Keep in mind the audience you have intended and how they might be using the data to inform institutional change. Feel free to revise other columns of your table as you complete the Benchmarks/Standards and Data Presentation column.
| What are the goal/objectives you are trying to achieve? | What are the questions you are trying to answer? | Source of data/method of data collection | Benchmarks/Standards and Data Presentation | Audience/ Stakeholders | Potential uses of the data |
Final Reflection
After completing this activity, reflect on your final product by responding to the questions below. You can do this exercise either through individual reflective writing or discussion with a partner.
- While creating the final product, what Benchmarks/Standards did you focus on and why?
- What factored into your decisions about how to present the data relative to the benchmarks? What important considerations did you feel were critical so that the audience will make the most of the data?
- For group dialog: Are there other potential ways to present the data that should be considered either for this audience or for a different potential audience?
Resources
Maki, P. L. (2010). Assessing for learning: Building a sustainable commitment across the institution. (2nd ed.). Sterling, VA: Stylus.
Suskie, L. S. (2009). Assessing student learning: A common sense guide. (2nd ed.). San Francisco, CA: Jossey-Bass.
Chapter 3: How can we move from ineffective uses of data to closing the loop?
Warm-Up Activity
Think back to the data used in the Biology program at Juan’s institution. Approximately, 54% of students identified correctly the pictures representing meiosis and approximately 21% identified correctly the pictures representing mitosis in a pre-assessment (the CAT) of incoming freshmen. At the end of the semester, the final examination results on the common question were: 80% of students identified the processes of meiosis and 34% identified the processes of mitosis. This data was shared with faculty, and stimulated conversations about teaching these foundational concepts, including the idea of a flipped classroom using a modeling approach to foster active learning. The data was used by an audience who had played a role in planning for the initial assessment, had expertise in the subject area, and could quickly implement changes based on the results. They also responded to the data in a measured way, not mandating change based on one year of results, but encouraging experimentation and ongoing data collection to explore the results of any changes. The second year’s course assessment plan involved the same “background knowledge probe” and the same common final examination questions. Out of twenty sections of the course, eight faculty agreed to design a flipped classroom and modeling approach to help students learn about these two foundational course concepts, and the results of the assessments could be used to explore the effectiveness of these new methods. The faculty seemed to understand the limitations of the data. Faculty response to the data was shaped by their professional judgment as much as by the data itself. They all had personal experience with students struggling with these concepts in the classroom, and relied on the work of others and their colleagues rather than the data itself to identify a potential solution. Their research on pedagogy and professional judgment suggested to them that more active learning through modeling of the processes of meiosis and mitosis could lead to better learning and that time for this active learning could be freed up by ‘flipping’ the classroom, so that delivery of content through lecture format was available to students outside of class time in video format.
It seems like faculty in Juan’s Biology program followed some of the advice from the prior section of this module, summarizing the data in a clear and concise manner (in their case using percentages) that effectively spoke to the level of competency achieved by students, and including on a modest scale multiple lines of evidence as they had both pre and post-tests for two closely related concepts. However, as the description above illustrates, there were a number of other factors that could be contributing to the effective use of the data that were potentially unique to the audience. The last time you considered Juan’s story, you expanded on the ways in which this data could be used effectively by audiences at the course, program, general education, and institutional level. Use the similar table below to consider how the data might alternatively have been used ineffectively by different audiences.
| What are the goals/outcomes you are trying to achieve? | What are the questions you are trying to answer? | Source of Data | Ineffective Potential Use at the Course Level/ Audience/ Stakeholders | Potential Ineffective Use at the Program Level/ Audience/ Stakeholders | Potential Ineffective Use for General Education Curriculum | Potential Ineffective Use for Institutional Effectiveness Audience/ Stakeholders |
|---|---|---|---|---|---|---|
| Develop student knowledge about fundamental biological principles. | How effectively were students prepared in concepts from their introductory Foundation courses for more specialized second year courses? | Background Knowledge probe on Mitosis and Meiosis, followed by assessment of the same knowledge on the course final exam. |
For each of the possible ineffective uses of data above, try to imagine what could have been done differently in order to insure more effective uses of data. How can the ineffective use of data have been avoided for:
- The Course level?
- The Program level?
- The General Education Curriculum?
- Analyzing Institutional Effectiveness?
Activity: Anticipating and Adjusting for the Audience
Presenting Data to Different Audiences
Based on the video you just viewed and your own experiences, consider each of these questions from a few different perspectives by responding to the prompts below:
How does this audience approach the process of assessment?
What are some approaches you should consider if the audience is likely to be:
- Fearful about the misuse of data (such as appropriating it for tenure and promotion)
- Skeptical about the value of the process (such as considering it a waste of time)
- Anxious about the results and the need to respond to them quickly
How well will this audience understand the data?
What are some approaches you should consider if the audience is likely to be:
- Unfamiliar with the assessment instruments
- Skeptical about the methodology you have employed
- Uncomfortable interpreting and working with numerical data
How well prepared is this audience to act on the data
What are some approaches you should consider if the audience is likely to be:
- Overwhelmed by competing priorities on campus
- Unfamiliar with the scholarship of teaching and learning related to this kind of data
- Unfamiliar with the campus policies and curriculum related to this specific data
Planning for the Effective Use of Data
In the preceding activity you considered a few examples of approaches you could use to address concerns about particular audiences for assessment data. While you are likely to encounter a wide range of attitudes and understandings about data, assessment and plans for improvement, one simple way to think about your audience is in terms of three groups: assessment champions, campus stakeholders, and the general public. Your assessment champions, tend to have the greatest knowledge and expertise about the assessment process, familiarity with interpreting data and to be prepared in some ways to act on the data, while the other groups may require more information and/or reassurances about assessment data. Please note that the table below is an extreme oversimplification intended only to foster discussion about some of the considerations for using data with different audiences.
| Questions | Assessment Champions | Campus Stakeholders | General Public |
|---|---|---|---|
| How does this audience approach the process of assessment? | Confident in the value of assessment and comfortable making measured judgments. | Potential mix of fear about uses of data and skepticism about the value of the efforts. | Potential push to act on assessment data without understanding the process completely. |
| How well will this audience understand the data? | Familiar with assessments and methods for analysis. | Range of comfort working with data and confidence in results. | May accept results as presented without fully understanding them. |
| How well prepared is this audience to act on the data? | Familiar with potential responses to assessment data. | Range of expertise and time to devote to responses to the data. | May not understand campus conditions and most effective actions. |
As the table illustrates, in order to insure your audience can make effective use of the assessment data, you must effectively communicate three major types of information:
- Information about the assessment process
- Contextual information about the data
- Actionable information from the data
The Assessment Process:
Addressing concerns about the use of data – How does your audience approach using assessment data?
The first module of this series, Assessment Benefits and Barriers illustrates that resistance to using assessment data can have little to do with the data itself, and instead be generated in response to fears about the potential misuse of data and/or skepticism about the value of the process as a whole. These fears are not entirely unfounded as some audiences for the data may also rush to act on assessment data particularly if it suggests issues with a program. As a result, one way to plan for effective use of data is to plan to insure your audience can respond to the data in a measured way. This involves avoiding mandating change based on limited results (for example one year of results), while encouraging experimenting with changes to try to address any issues revealed by the data, and supporting this experimentation with ongoing data collection to explore the results of these changes. With this in mind, a number of steps can increase the likelihood that your audience takes a productive approach to using assessment data:
1. Share aggregated results
To allay fears about the misuse of data and to insure faculty anonymity in the analysis of the data, it is generally best to only present the data in the aggregate. The purpose of this data is not to try to change an individual faculty member’s pedagogy, but to spark a broader discussion about teaching and learning that may result in many faculty adjusting their teaching approaches or making other changes to the curriculum. There are exceptions to this as you may have an assessment champion willing to share their individual results, and doing so may allow everyone to feel more comfortable about the process. Furthermore, there may be times when you want to disaggregate the data to explore a question about a particular group of students. In such cases it is essential to take other steps to insure anonymity.
2. Involve your audience in planning
One of the best ways to build comfort and confidence with the use of the data is to engage your audience in planning the data collection and data analysis process. While this isn’t always possible, if you provide your audience with a chance to think about the modes and methods of data collection in advance, they can address their fears and concerns at that point, and the data collection and data use plan can be developed in a manner that is most sensitive to their concerns.
3. Sandwich bad news between good news
Another important consideration in helping your audience to feel comfortable with the assessment process is to illustrate directly that it is not about finding fault with students, the curriculum and by extension the hard work of faculty and staff. This can be done by emphasizing both positive and negative results about student learning. This can also insure that an audience anxious to look for faults to address, can see that there is also valuable teaching and learning occurring. This will highlight the important point that any changes should be made in ways that preserve the good, while addressing the issues uncovered.
4. Be diplomatic, gentle and sensitive
When sharing and discussing data it is critical to remember that often your audience has made teaching and learning their life’s work, and the results can feel like a very personal reflection on them and their students. While celebrating success and keeping the data aggregated as mentioned above, offer two important approaches to this issue, it is also critical to simply acknowledge throughout your discussions what a challenge teaching and learning can be for both faculty and students. It is also important to capitalize on this shared passion of your audience for improving teaching and learning, by fostering a collegial atmosphere of mutual support, stressing that you are all working towards the same goal of improving teaching and learning.
5. Provide corroborating information
One final consideration for addressing concerns about the process itself, is to illustrate to your audience that these efforts correspond with efforts going on across the country to improve teaching and learning and they are not alone in these struggles. Case studies and research at other institutions and nationally, can provide corroborating information that makes negative results less of a personal threat to the audience and more of a collective problem to be addressed. Ideally, this information can also illustrate for the audience, that the assessment process has yielded positive results on other campuses (or even in other departments), reinforcing the value of these efforts.
6. Take time to listen!
All of the suggestions above assume a range of attitudes and opinions about assessment from your audience. While it is important to try to anticipate these issues in advance, when the time comes to actually present to the audience, it is even more important to give the audience time to express these concerns, to listen to them carefully and to respond appropriately. Engage with your audience about the data inquiry process you will be guiding them through, explaining how the data will be aggregated, reminding them of their role in assessment planning, explaining that you have some encouraging data, and potentially discouraging data, acknowledging their commitment to students and the challenges they face, and providing examples from other programs. Then give them time to ask Process Questions about how they will be engaging with the data. Encourage them to hold off on detailed questions about the data until they’ve seen it and you’ve address all of these initial process questions.
Contextual Information:
Addressing what your audience needs to document the effectiveness of your assessment – How well does your audience understand the assessment(s)?
A second major concern about the effective use of assessment data occurs when your audience does not understand or lacks confidence in the results of the assessment itself. These issues can arise when the audience is unfamiliar with the processes you used to collect, and analyze the data, does not tend to approach questions quantitatively, or is very familiar with quantitative approaches and demands a high level of scientific rigor when analyzing data. Ideally, as mentioned above, these issues can be addressed in part when the audience has also played a role in planning for the initial assessment, because they will have had the opportunity to learn about the assessments and data collection methodology through their role in designing them, and to make changes if they had concerns. However, this is not always possible, and most often your audience will consist of some who have played an integral role in planning for the assessment and others who have not, and may not even have expertise in the subject area. Given that this is the case, there are a number of steps that can be taken to help your audience understand the data:
1. Recruit your assessment champions to explain the data
It is important to remember that you may not always be the best person to explain the data to your colleagues and you don’t have to do it alone. Given the inherent differences in how data is approached in different disciplines, it can help to have someone else who is trained in that disciplines explain the data. Ideally, such a person will also have valuable insight into the content of the discipline and can help to explain the reasoning behind the instrument used to collect the data, and comment on its validity. Even if you are an expert in the content area yourself, it is always helpful to have one or more additional people with insight into the data to help foster an effective discussion.
2. Provide sample sizes, sampling process, details of wording, and information about validity and reliability
Although audiences will vary in the extent to which they engage with additional details about the data, it is always better to have those details readily available for the audience members. It can slow down or even impede the effective use of the data, if you have to promise to get that information for them at a later date. Some audience members will want to know how many individuals were in the sample and how they were selected in order to make their own judgment about whether the sample was truly representative. You can also provide information about the demographics of the larger population (students in the major, at the institution, etc.) and provide comparable data for the sample to illustrate whether it was truly representative. Some audience members will want to review the assessment instrument itself to evaluate the specific wording to better interpret the data and make their own judgment on the validity of the instrument. You should provide this information, at least for the sections of the instrument relevant to the data you are presenting and be prepared to provide additional data about validity and reliability including correlation between different measures of the same outcome for the same group of students (when possible) and between scores by different raters (if relevant to the instrument). Overall, be sure to make the data clear and understandable: Make table and figure titles, labels and legends clear and self-explanatory.
3. Credit others, documenting who, when and how the instrument was created and data was gathered.
To the extent that you have engaged partners at the institution or outside the institution, including faculty, in designing and implementing the assessment, explain this process to your audience. While some audiences will look to the data itself to evaluate whether the sample was representative and the data valid and reliable, other audiences or audience members will be more interested in knowing the people involved in the data gathering process to make judgments about whether they feel comfortable with the data. If you have engaged people with appropriate credentials, who they trust, and you explain their involvement throughout the process, this will help many audiences to feel more comfortable about the data. In fact, even if everyone in the audience was involved in designing the instrument, and collecting the data, you should still acknowledge and remind them of their involvement, as it will help reinforce the sense of a shared responsibility for using this data to make meaningful improvements in teaching and learning.
4. Offer additional information, both qualitative and quantitative, to support your findings
As noted previously, an important way to document the validity and reliability of the results is to illustrate how they correlate with other measures of student learning. However, this is not restricted to quantitative methods alone. Often, such quantitative analyses are not available to your or may be inconclusive. While such information is useful when it can be made available, it is also important to provide qualitative support for the data. On the one hand, you can compare student self-reported data about their learning with the results of a direct assessment such as their scores on a rubric. On the other hand, you can present those scores on a rubric, only after you have given your audience an opportunity to review and perhaps even score themselves one or two samples of the student work from the data set. Ideally, by allowing your audience to triangulate between different findings about student learning, including their own impressions from the work itself, you can best prepare the audience to reflect and act on the data.
5. Be honest about flaws
Finally, while most of the suggestions above, assume that the data is valid and reliable, you will, in reality, be presenting data that varies along a continuum in its validity and reliability. It is critical that you discuss the flaws in the data openly and honestly, while avoiding getting hung up with the audience trying to make a binary judgment about whether the data is good or bad, but instead recognizing its strengths and weaknesses. It is often helpful to acknowledge that their data falls somewhere on a range of potential data they could be using, from anecdotal data about student learning (“my students seem to really struggle with critical thinking”) to a carefully controlled experiment into student learning using multiple measures. Focus on what can be learned from the data, rather than what can’t. We are all often stuck with data involving small sample sizes or imperfect methodologies, but when faced with questions about the validity or statistical significance of the results, you can remind the audience that this data was not collected to prove student learning, it was collected to help improve student learning, and may provide added insight towards that goal.
6. Take time to listen!
Once you have provided all of the basic information they will need to interpret the data, be sure to give them the opportunity themselves to raise any of the kinds of concerns described above. Allow time for your audience to begin their inquiry of the data by asking Clarifying Questions. These are questions that help them understand how, when, where, from whom and by whom this data was collected. Encourage them to hold off on questions about what the data does or doesn’t suggest until after they have had a chance to ask and you have had the chance to address all of these clarifying questions.
Actionable Information:
Information your audience cares about – How well prepared is your audience to act on the data?
The third concern to address when trying to insure the effective use of data occurs when your audience accepts the data, but fails to act on it in any meaningful way. Your audiences will vary in the expertise and time they have available to actually make use of the data. Even when faculty have expertise in the subject area, and are involved in teaching and curricular design, they may not quickly implement changes based on the results, if they do not see their relevance, understand their importance, or can’t identify potential solutions. You must consider how you can share the data in ways that will allow audience members to engage with potential solutions within the limits of their own time commitments and expertise. In order to insure this, you should structure your plans for using the data in ways that insure you are engaging your audience with:
1. Matters your audience can act on
In the assessment process, you will often collect much more data than you can actually use to inform changes at your institution. As mentioned previously, you will want to address both positive results with a discussion of what contributed to those positive results, and negative results, with a focus on what the audience can do in response to those negative results. Avoid putting too much information in, particularly if that information does not suggest what is being done well that could be expanded on or replicated, or what is going poorly, but could be addressed by the audience. While it may be important to your audience to have all the data available for their review, you can focus their attention on the elements of the data they can act on if you provide executive summaries and concise handouts that highlight important findings. Some ways to make your presentation concise include using round numbers, headings and subheadings, and bulleted lists.
2. Interesting and unanticipated findings
A second valuable criterion for focusing the presentation and discussion of data is to highlight the most surprising and intriguing findings. In some instances, there may be a wide range of potentially actionable data, and it would be difficult for your audience to productively engage with it all given time limitations. If this is the case, you will need to judge what makes some of the data more interesting or surprising. This requires placing the data in a broader context. Are there ongoing initiatives on campus or in the program that some of the data speaks to? Is there historical data on student learning either from your program, across the institution, or from other institutions that this data differs from or is similar to? As mentioned in the prior section on contextual information this additional data may be quantitative or qualitative, including general attitudes within a program or across the institution that the data can address. In order to engage the audience, put the results in a relevant order to at conveys your message by leading with these most interesting and unanticipated findings.
3. Meaningful differences
Data that is actionable and interesting, should also in many cases be characterized by some meaningful difference between it and other data collected in this same assessment cycle or in the past. This may involve comparing scores or responses on one element of a rubric or survey, to scores or responses on other elements of the same rubric or survey. It might also involve comparing these scores or responses across multiple years of data. As mentioned in the prior section of the module on setting benchmarks and expanded on in identifying the information to analyze and present, there are a variety of ways to establish benchmarks and present data to illustrate meaningful differences between the data and benchmarks. As you are sharing data with your audience, you can engage them if you use boldface, italics, borders, colors, bright lines, etc., to highlight these meaningful differences.
4. Relationships between Educational Inputs, Experiences and Outputs
It is not enough to simply illustrate actionable, interesting and meaningful differences in the data. As described in the Gathering Data module, you will ideally have quantitative and qualitative data on educational inputs, educational experiences and educational outputs related to your learning goals and objectives. The relationship between these three types of data should be explored when sharing the data. What do the data tell you about what students already knew (educational inputs)? What do the data tell you about how students have engaged with and progressed through the curriculum (educational experiences)? What do the data tell you about what students know by the end of the curriculum (educational outputs)? As mentioned previously this data is not simply quantitative data, it is qualitative data and some of that qualitative data will emerge through discussions. For instance, if student learning were assessed by a standardized test score and scores were particularly law for a course taught by adjunct, you might assume the instructor was not qualified to teach the material. However, on closer analysis, incoming preparation for those students might have been lower than thought, or the educational experience could have been impacted by factors outside the instructors control, such as snow days, technology issues, or time of day the course meets. In order to engage the audience fully with data on educational inputs, experiences and outputs, encourage exploration and asking questions before making connections based on assumptions.
5. Help audiences see potential solutions
Given the potential limitations in your audience’s time and expertise to respond to the data, it is critical to be prepared with a range of potential solutions, drawn from best practices in the literature. In many cases, you will have audience members with a broad range of ideas about how to address any potential problems, and those should be discussed and explored first. However, as the person who has had the most time to initially reflect on the data, you should anticipate what some potential solutions might be and be ready with a variety of options. You can move things forward efficiently by focusing discussion and dialogue on actionable, interesting, and meaningful differences in educational inputs, experiences and outputs, but if your audience struggles with finding or arguing about potential solutions, the process can grind to a halt. Be prepared with literature and/or case studies from other programs/institutions that address the same issues raised by the data.
6. Take time to listen and document what you hear!
While it is important for the purposes of efficiency to help guide your audience through the process of engaging with the data, and generating potential solutions, you must also allow them to express their own views and interpretations of the data. They need time to make their own sense of the data. You can begin by encouraging the audience to describe patterns in the data, while resisting the urge to draw any conclusions from these patterns. Have the audience members simply describe what they see. Once you are comfortable that the audience understands the data itself, they can then begin to describe what it means. Encourage the audience members to move from identifying the meaningful differences and patterns in the data to suggesting what this means for teaching and learning. It may be valuable to encourage the audience at this point to ask probing questions about the data. This process allows audience members to withhold final judgments about the meaning of the data, by presenting their inferences as inquiries rather than statements. For instance: “is it possible that our introductory coursework isn’t giving the students enough opportunities for practice and feedback on the elements of critical thinking?” This can lead to further inquiry such as “are there alternative explanations” or “are there common themes if faculty experiences and stories are consistent?” Finally, it is critical to record, document and follow-up on all of this dialog, particularly any final recommendations that emerge from the discussion. Too often assessment efforts don’t lead to meaningful change because no one takes the time to record the ideas that are generated and to refer to them when planning for the future.
Activity: Completing Your Data Use Plan
In the first two sections of this module you continued work on an assessment plan that is also covered in the module on Gathering Assessment Data. Either drawing from that module or independent of it, you identified a set of learning goals and objectives, assessment questions, types and sources of data for your data use plan. You also added benchmarks/standards and data presentation, who your stakeholders were for the data, and the ways you might use the data to inform changes at your institution.
For this activity, please focus your attention on the data use plan again. In the last assignment you were asked to identify some steps you could take to respond to your audience as a function of how they might feel about the assessment process in general, how comfortable they could be with the data itself, and how well prepared they were to analyze and act on the data. The content that followed, provided a detailed analysis of a variety of ways to address each of these areas of concern. For this final activity you will be filling in one more column to identify your plans for convening your audience in ways that address potential concerns about:
- The Assessment process (what process information will you share, what people and resources will you rely on to help you, and how will you involve your audience?)
- Contextual information (what contextual information will you share, what people and resources will you rely on to help you, and how will you involve your audience?)
- Actionable information (what actionable information will you share, what resources and people will you rely on to help you, and how will you involve your audience?)
In addition, you can use the information you just reviewed to revise how the data will be presented relative to the benchmarks, as well as to reconsider the potential uses of the data. Keep in mind the audience you have intended and how they might be using the data to inform institutional change. Feel free to revise other columns of your table as you complete the process of convening audiences/stakeholders.
| What are the goal/objectives you are trying to achieve? | What are the questions you are trying to answer? | Source of data/method of data collection | Benchmarks/Standards and Data Presentation | Process of Convening Audience/ Stakeholders | Potential uses of the data |
|---|---|---|---|---|---|
Final Reflection
After completing this activity, reflect on your final product by responding to the questions below. You can either do this exercise through individual reflective writing or through discussion with a partner or in a group of three.
1. While creating the final product, what processes and approaches for convening your audience did you focus on and why?
2. What factored into your decisions about how to present the data:
- In the context of the overall assessment process?
- To support understanding the data relative to the benchmarks?
- Focusing on actionable and interesting results in ways that would generate meaningful responses to the data?
3. For group dialog: Are there other potential ways to convene your audience in discussions about data that should be considered either for this audience or for a different potential audience?
Resources
Suskie, L. S. (2009). Assessing student learning: A common sense guide. (2nd ed.). San Francisco, CA: Jossey-Bass.
Conclusion and resources
Summary of Key Points
How can and should assessment data be used?
- Data should be used in context by engaging data users in designing, reviewing, and/or using the assessment instruments, and establishing clear benchmarks and standards.
- Data should be presented clearly, concisely and without bias by summarizing the data graphically and statistically, and engaging in honest, open discussions about the strengths and limitations of the data.
- Data should be shared with an inclusive group of stakeholders to draw measured, informed conclusions.
- Data implications and resulting recommendations should be discussed, recorded and followed-up on to insure the data is used effectively to improve teaching and learning.
What are the range of ways to use assessment data?
- Data can be used in comparison to competency-based standards for student achievement developed locally or externally.
- Data can be used in comparison to benchmarks based on the performance of other students locally, nationally, historically, and potentially with adjustment for educational costs.
- Data can be used to compare student growth and achievement relative to their prior learning, their overall potential, or for different learning goals.
- Data can be used to identify discrete levels of student achievement summarized through the mode or median, performance along a continuum expressed as a mean on a bar chart, or percentages of students performing at a given level.
- Data can be used to describe the variation in student achievement summarized as the range, interquartile range relative to the median in box and whiskers plots, or standard deviation, standard error, and confidence intervals around a mean on a bar chart.
- Data can be used to determine the distribution of student achievement as skewed towards lower or higher values, normally distributed, or bi-modally distributed into clusters of low and high performing students.
- Data can be used to determine the likelihood that you might conclude there is a difference between two groups, when there is no difference (probability value of a Type I error), but you also run the risk of concluding there is no difference, when one actually exists (Type II) error.
- Conclusions from statistical tests of significance should be validated through multiple lines of evidence, because they depend on the underlying distribution of the data (parametric vs. nonparametric), the size of the sample collected, the number of comparisons you are attempting to make, the size of the difference you are trying to detect, and they cannot tell the whole story of the interaction between educational inputs, experiences and outputs.
How can we move from ineffective uses of data to closing the loop?
- Understand your audience, in terms of how they approach the process of assessment, understand and interact with assessment data, and are able to analyze, and act on the data.
- Help your audience to understand assessment as an inquiry-based, iterative process to evaluate and improve a curriculum rather than individuals, and to do so in a measured way that privileges ongoing, collegial experimentation, data collection and refinement over hasty, unilateral judgments.
- Provide your audience with a clear understanding of, and if possible experience with the instruments used to collect the data, as well as an honest and transparent discussion of the strengths and weaknesses of the data in terms of representing your students, and validly and reliably measuring their learning.
- Foster focused discussions on actionable, interesting, and meaningful differences in student learning inputs, outputs, and educational experiences.
- Draw on prior assessment activities within your program, elsewhere at your institution, or at other institutions through case studies or publications, to illustrate the positive value of the assessment process, to add support to your findings, and to help your audience see potential solutions.
- Take time to listen to your audience and document their ideas, through opportunities for process-oriented and clarifying questions, descriptions of the data, and probing questions about what it suggests, and final recommendations that can be followed-up on to close the loop.
Final Reflection
Look over your completed data use plan. Can you articulate rationales for each question you are trying to answer (or goal you are trying to achieve), the approach you proposed for benchmarking and presenting the data, and the process you proposed for convening the audience for your data (when, who and how)?
Reviewing and reflecting on your data use plan with a critical eye may help you to identify gaps or revisions that need to be made and ensure that you will be able to justify your decisions.
Cited & Additional Resources:
Maki, P. L. (2010). Assessing for learning: Building a sustainable commitment across the institution. (2nd ed.). Sterling, VA: Stylus.
Suskie, L. S. (2009). Assessing student learning: A common sense guide. (2nd ed.). San Francisco, CA: Jossey-Bass.
Introduction
Planning for the sustainability of assessment practices is a key component of ensuring the success of assessment initiatives at the course, program, and institutional levels. This module explores how assessment initiatives can fit into a broader strategic plan at an institution and how best to evaluate institutional-level assessment practices. This module also examines the common obstacles to developing sustainable assessment programs and practices. Examples are provided throughout along with a template for reviewing current assessment practices and creating new sustainable assessment initiatives at the course, program and institutional levels.
Developing Sustainable Assessment Practices Facilitation Guide
LARCÂ Beta-Testing Institutional Example 1
LARCÂ Beta-Testing Institutional Example 2
LARCÂ Beta-Testing Institutional Example 3
Intended Audience
This module is intended for faculty, staff, administrators, or other institutional stakeholders who are:
- Involved in assessment efforts, and/or
- Charged with training or educating their peers and colleagues about assessment.
Goals
This module is designed to help participants:
- Understand the importance of planning for sustainability to avoid some common hurdles.
- Analyze your institutional assessment practices to recognize potential hurdles to overcome as well as opportunities to build sustainable assessment practices.
- Recognize how you can apply guiding principles to sustain assessment efforts on your campus.
Objectives
Upon completion of this module, participants will be able to:
- Review current assessment practices at your institution.
- Identify common hurdles to developing sustainable assessment practices.
- Ask questions at the department, program, and institutional-levels to identify hurdles that need to be addressed in order to create sustainable assessment.
- Assemble an inventory of current assessment practices at your institution at the department, program, and institution levels.
- Articulate how assessment initiatives fit into a broader strategic plan at an institution.
- Recognize best practices for evaluating institution-level assessment practices.
- Evaluate the sustainability of current assessment initiatives at your institution.
- Recommend changes, if needed, to improve the sustainability of current assessment practices at your institution.
- Create a plan for implementing new sustainable assessment initiatives at the course, program, and institution levels.
- Articulate individual guiding principles for assessment.
Chapter 1: What do sustainable assessment practices look like?
Warm-Up Activity
One objective of this module is to identify common hurdles to developing sustainable assessment practices. The goals here are to:
1) Engage in a purposeful and practical review of assessment practices in order to intentionally plan for the role of strategic collaborations in both identifying common assessment hurdles and how to exceed them, and to
2) Optimize shared resources and intentional channels of planning and communication — key strategies in moving an assessment stall forward.
To begin with, focus on an assessment project or initiative on your campus that has stalled. Here are some prompts that may help frame your response:
- Did the project stall at the department level, the program level, or the institutional level? Why?
- What were one or two of the most significant reasons for that assessment project to stall?
Now, consider an assessment process that has been sustained on your campus or elsewhere:
- Why is it continuing?
- What do you consider the three most important features that must be fostered for an assessment project to result in actionable data and sustainable, institutional knowledge about learning?
Watch the video of interviews with faculty and staff about hurdles and successes in sustaining the assessment process.
Activity: Identifying Common Hurdles and Key Characteristics of Sustainable Assessment Practices
After viewing the video, return to the examples of stalled and continuing, sustainable assessment processes from your own institution and respond to the following prompts:
- Have you thought of any other hurdles that likely contributed to one of your assessment practices’ stall? Generate a succinct list of the hurdles you’ve encountered.
- In both stalled and sustained assessment efforts, how did the individuals responsible for the project move the project forward? Or did they? What happened if the project didn’t move forward?
- Who else with a particular area of expertise might have been involved in either the planning process for an assessment project in order that the project close the loop effectively and result in actionable data?
- What do you consider the three most important features that must be fostered for an assessment project to result in actionable data and for the assessment cycle to close the loop?
Guiding Principles for Creating Sustainable Assessment Practices
The assessment of student learning is the most powerful means for building on an institution’s capability for continuous organizational learning and improvement. Assessment, however, is hard work, and in order for assessment to be a sustained, collective institutional commitment over time, assessment must be a collaborative process and must be included in an institution’s strategic plan as a key strategic priority. Sustainable assessment starts there.
In Assessing for Learning: Building a Sustainable Commitment Across the Institution, Peggy Maki defines sustainable assessment practices as a collective commitment, which builds over time, and involves resources, structures, and processes that result in actionable data at all levels of the institution. While the last section of this module outlines what Maki identifies as the three major components of sustainable assessment processes, at its core, sustainable assessment practices are collegial, collaborative, and inclusive.
Institutional knowledge about student learning is sustained by intentional and multiple channels of communication about learning with the following goals:
- Share information in order to promote discussions about teaching and learning at the institution, program, and department levels
- Engage members of the community in interpretative dialogue that leads to change or innovation and builds on institutional learning
- Inform institutional decision-making, planning, and budgeting focused on improving student learning. (Maki 2010)
Communication plans about assessment, assessment mentoring networks, and information sharing must be intentionally planned for and campus resources strategically leveraged in order to build a culture of assessment that is sustainable, manages to outcomes, and stewards a culture of assessment that is both dynamic and adaptive – always driven by an institutional commitment to make student learning the driver of any assessment initiative or project at any level of the institution.
Below are a number of potential considerations for sustaining assessment as an institutional initiative as well as sustaining assessment projects at the course and program level. At their core, they all focus on building a broader, inclusive culture of assessment.
- Spotlight assessment in the institution’s strategic plan; leverage resources for assessment
- Provide a space and make time for collaborative problem solving and information sharing; inventory what venues already exist that can be used for these conversations concerning assessment at all levels of the institution.
- Provide frequent opportunities for individuals to explore data together and engage in collaborative dialogue on strengthening the institution and student outcomes
- Understand, at its best, a culture of assessment is both manageable and sustainable because it is a collaborative process that intentionally involves multiple perspectives, various talents, and varying levels of expertise from across campus.
- Provide faculty and staff with constructive feedback on their assessment reports
- Provide the leadership and investment to support inquiry and evidence based action
- Engage multiple units in exploring the results of assessment; break down silos.
- Understand that multiple solutions are usually necessary to address areas for improvement; employ mechanisms that can provide continuous feedback so that the use assessment data can be implemented in a timely and responsive manner.
- [for Campus Leaders] Answer the question from faculty and staff: “What happens if I participate in assessment?” (adapted from The RP group)
Activity: Prospective Hindsight — A Preliminary Step in Assessment Project Management
Introduction
Here, we’ll look at five of the most common and pervasive hurdles to building, stewarding, and sustaining a culture of assessment on campus; we’ll also use a planning technique to make common assessment hurdles transparent with the goal of actively preparing for them.
Many of us may be familiar with an organizational debrief called the post-mortem. A post-mortem is used to reflect on what’s occurred after an event has already taken place. It’s a term used in the process of determining the reasons for an organizational failure or crises (Sanaghan, 2009).
A pre-mortem is an analytic tool or exercise that considers in advance potential issues inherent in a process or a plan with the goal of preparing for them (Sanaghan, 2009). Consider these five common hurdles that can often stall an assessment process. You will recognize many of them from the video you watched earlier as well as from your own reflections on stalled assessment efforts at your institution.
According to much of the research literature on assessment, some of the most common and pervasive hurdles to sustaining assessment are:
- Limited time to conduct assessment
- Limited resources to put toward assessment
- Limited understanding or expertise in assessment
- Communication channels regarding assessment on campus are developing or not consistently defined
- Perceptions regarding the benefits of assessment are limited
Instructions
Use your existing assessment plan or a draft assessment plan for this preliminary analysis. A lot of time and energy went into your plan’s design. You will roll it out at the beginning of fall semester, but before you do, conduct a preliminary analysis and ask “what might emerge as potential hurdles in this year’s assessment plan? Why? And what practical action steps can I take to avoid or proactively address a stall in the process?”
The goals of this activity are:
- anticipate potential stalls with the assessment plan before it’s implemented based on these five common hurdles
- consider who else on campus (strategic collaborations) could be consulted and what early actions you can take in order to effectively prepare and resolve them. Include other considerations that are unique to your institution.
Recall the maxim: measure twice, cut once.
If you are working independently on this activity, review each of the hurdles with the goal of identifying which ones could emerge as potential issues, leading to the plan’s stall. Next, consider strategic collaborations in order to engage and resolve these stalls and/or hurdles.
If you are working in a small group on this activity, based on these five items, ask the group members to identify what they understand as the most significant causes for why an assessment plan could potentially stall. Compare your lists. Next, together identify the one item that the group considers the biggest hurdle that could cause the assessment project’s stall. Then, brainstorm and discuss a strong recommendation that would effectively deal with the hurdle. The goal here is to consider in advance how to anticipate potential stalls based on these five common hurdles to sustainable assessment practices, and to consider how to move the project forward, especially in collaboration with various members of your campus community.
After completing the activities, reflect on the process you have engaged in this module so far by responding to the questions below. You can do this exercise through either individual reflective writing or discussion with a partner.
- What limitations have you uncovered in the sustainability of your own assessment efforts?
- In what ways have you expanded on your understanding of the potential barriers or hurdles to implementing and sustaining assessment practices?
- What guiding principles have you begun to identify for ensuring sustainable assessment practices?
- What steps can you envision taking on your own campus to ensure greater sustainability of your assessment efforts and assessment plans?
- For group dialogue: What is one piece of advice or information that you would give your colleague if they asked for feedback on how to improve and/or re-prioritize their goals for sustainable assessment practices?
Resources
Maki, P. L. (2010). Assessing for Learning: Building a Sustainable Commitment across the Institution. 2nd ed. Sterling, VA: Stylus.
Sanaghan, P. (2009). Collaborative Strategic Planning in Higher Education. Washington D.C.: NACUBO. National Association of College and University Business Officers. https://rpgroup.org. The Research and Planning Group for California Community Colleges.
Chapter 2: How do you know if your assessment practices are sustainable?
Warm-Up Activity
For many of the online modules, we ask you to think about and work on what you are doing in your course, program or academic area in terms of assessment. If you have completed other modules, you have reflected on your own current assessment process in a variety of ways. However, to begin this module, we would like to ask you to think about what is going on in terms of assessment outside of your area of focus. Ultimately, for your own cycle of inquiry to be most sustainable at your institution, you should be able to benefit from the support of others engaged in assessment on your campus.
Take a moment to fill out the table below including your own program as well as any others you have some familiarity with at your institution. If you do not know what is going on in other programs take the opportunity to reach out to at least two colleagues to find out what they are doing. Even if you can only complete a couple of columns for a program, try to include as many programs as you can.
| Program or Academic Area | Goals and Objectives Being Assessed | Data Being Collected | Process for Reviewing the Data | Changes made as a result of using data | Use of data for program review or external accreditation |
|---|---|---|---|---|---|
Once you have completed the table, consider the following questions:
- Are there any interesting areas of overlap between your program and others in terms of the goals and objectives you are assessing?
- Are you collecting data in similar or different ways from other programs, and can you see opportunities for sharing data or data collection approaches?
- Did you encounter any interesting ways in which other programs review their data?
- Can your program benefit from considering some of the types of program changes that have been made in other programs?
- To what extent at your institution has the assessment process been integrated into the process of program review and/or external accreditation?
Download the following activity worksheet to input answers into the table presented above.
Monitoring Assessment Activities and Making Them Part of Everyday Processes
In order for assessment to be sustained in your courses, program and across the campus, it is critical that you, your colleagues, and the administration, understand and support the process, not just as a requirement of periodic accreditation, but as an everyday process to strengthen teaching and learning. To that end we will look at the ways in which you can recognize and analyze what is going on at your campus in terms of each of the elements of the cycle of inquiry (Can I reference the cycle from another module?) as well as in terms of institutional resources and support. In order to critically evaluate the sustainability of our campus cycle of inquiry, we will examine the processes through a variety of lenses or ‘frames.’
Bolman and Deal (2013) have proposed 4 ‘frames’ for examining organizations that may be useful in considering the assessment activities and processes at an institution: the symbolic, political, structural and human resources frames. If you examine the other modules in this program, you will note that we have defined the cycle of inquiry in terms of 4 basic components: Setting Goals and Objectives, Gathering assessment data, Using assessment data and in this module, Supporting sustainability of the cycle. When considering each of these components of the cycle of inquiry at an institution, viewing them through the four frames of reference, can be informative:
- Symbolic Frame: Evaluating the cycle of inquiry through the symbolic frame involves considering the messages your institution is sending about the ways in which it values the assessment process, and what in particular about assessment is valued. These messages can be conveyed in many small ways, but in particular when we publicly identify what our institution wants to learn about our students, share what we have learned and what is being done with that information, and celebrate the efforts of the individuals and groups involved. As we analyze through the symbolic frame, we must consider what we are communicating about assessment at our institution, and whether those messages will support the sustainability of our work.
- Political Frame: Examining the cycle of inquiry through the political frame requires that we consider what individuals and groups on our campus have the power to support or thwart our assessment efforts. By considering the ways in which we can build coalitions, recruit allies and look for opportunities that provide mutual benefits for different parties, we can help insure the sustainability of our assessment practices. We must engage these stakeholders in the processes of establishing goals and objectives, gathering data, and using the data to make meaningful changes. As the benefits of assessment are shared across the campus by the same individuals with the power to sustain these efforts, we can maintain the momentum of our cycle of inquiry.
- Structural Frame: Analyzing our cycle of inquiry through the structural frame involves examining the ways in which we organize the roles, responsibilities and standard processes of assessment. This includes the way we organize the process of setting goals and objectives, gathering data, and using assessment data. Sustainable assessment processes require organized structures that insure the work gets done, meaning that we know what the work involves, when it needs to get done, who is responsible for it, and how it impacts our institution. They also require that the work be manageable given the structures we have put in place in order for us to sustain this cycle of inquiry over the long term.
- Human Resources Frame: Ultimately, the work of assessment is done by a variety of important people at your institution. While the structural frame involves knowing who they are and what they do, the human resources frame, involves considering how we recruit, retain and support them. In particular, given that so much of our assessment efforts relies on the work of faculty, in order to insure a sustainable cycle of inquiry, we must provide people with the appropriate incentives and training.
1. Setting Goals and Objectives: Understanding what your institution wants to learn
One of the critical elements of the cycle of inquiry is introduced in the module on Goals and Objectives. Whether you are just starting to develop assessment at your institution or working to sustain the cycle of inquiry, it is essential that you have a shared vision for what you hope to achieve through the assessment process. Maki (2010) refers to this as “Reaffirming agreement on what you want to learn.” In the context of sustaining your assessment efforts this can involve looking beyond the narrow focus of a single program, or even the narrow focus of your individual institution to connect what you want to learn to similar priorities shared by others.
When viewed through the Symbolic frame, these efforts to connect your goals and objectives to broader institutional and multi-institutional efforts represent opportunities to send clear messages about the importance of your assessment efforts.
When viewed through the Political frame, these efforts also represent opportunities to identify and ally with partners whose resources and influence can help sustain your assessment efforts.
Whether it is simply another program on campus that is hoping to accomplish the same thing, or a national accrediting organization that holds your program or campus accountable to demonstrate student learning, sustaining your cycle of inquiry should involve making both symbolic and political connections through identifying networks of groups with shared interests and connecting to key stakeholders. Some potential examples of each are provided below:
Identifying or uncovering prior networks
- Institutional learning outcomes and assessment
- Institutional mission statements
- Institutional accreditation standards
- Program accreditation standards
- National Initiatives like AAC&U LEAP
- Strategic Plan and/or Academic Plan for the institution
Connecting to key stakeholders
- Office of Institutional Assessment, Research, Effectiveness or Planning
- Grant Center
- Allied Departments (Department Chairs or Assessment Coordinators)
- Allied Divisions (Deans or Assessment Committees)
- Institutional Assessment Committee
- Feeder or Transfer institutions (2 year and 4 year partners)
2. Gathering Assessment Data: Taking inventory of what kind of data is being collected, how much (sample size), when, and by whom
Just as the cycle of inquiry requires clear goals and objectives, it goes without saying that no assessment can proceed without a process for collecting data. The process for developing a data collection plan is outlined in the Gathering Data module. This element of the Cycle of Inquiry can be viewed critically through the Structural Frame with an effort to determine if the organized structures we have in place, represented by our data collection plan, will insure the necessary work gets done in an ongoing way from year to year. Below is the table used in the Gathering Data module to help develop a data collection plan. We can critically examine such a plan with an eye towards insuring sustainability.
| What are the goals/objectives you are trying to achieve? | What are the questions you are trying to answer? | Category of Data | Source of data/method of data collection | Timelines/Deadlines | Roles and responsible individuals, and groups? |
|---|---|---|---|---|---|
In the warm-up activity for this part of the module, you considered some of the elements of the data collection plans of other programs at your institution including the goals and objectives and data being collected. If you have identified networks of groups and key stakeholders with shared assessment priorities, sharing data collection plans allows you to take a closer look at opportunities to partner and build efficiencies. As you evaluate data gathering plans using the structural frame, you must look beyond the goals and objectives being assessed and types of data being collected, and also consider the organizational structures (including roles and responsibilities of individuals and groups) and processes (including methods of data collection and timelines/deadlines) to look for ways to insure they are sustainable. Some of the organizational structures to examine are provided below:
Organizational structures responsible for oversight:
- Curriculum committee
- Assessment committee
- Office of assessment
- Office of institutional research and planning
- Assessment coordinator
- Faculty teaching courses that are impacted (perhaps linked in an inquiry team)
- Alumni or Employer advisory boards (perhaps with a role in scoring student work)
As you consider who is responsible, it is essential to determine whether the structure you have in place is sufficient to accomplish the necessary work, and when possible identifying or creating new and/or complementary structures on your campus. While this may sometimes mean improving your organizational structure to insure the work gets done, it may in other cases involve streamlining your processes so the work can be more easily achieved including adjusting your methods of data collection and timelines/deadlines. While there may be other ways to streamline the process particularly through partnering with others seeking similar information, two critical questions to ask involve how much data you should collect, and how often to collect the data: Maki (2010) frames these in terms of “Determining your sample size” and “Identifying times and contexts for collecting evidence.” Examples of considerations about sustainability relative to each of these are provided below.
Approaches to sampling student work
- Random and stratified random sampling: Your data gathering plan may call for random sampling in an effort to reduce the overall amount of data that has to be collected while still insuring a reasonably representative sample of student work. The sample size can potentially be even further reduced while still insuring a reasonably representative sample by conducting stratified random sampling, identifying relevant demographic groups, and then taking a random sample from within each demographic group. However, in evaluating how sustainable such practices are it is important to recognize that the process of creating such random samples does place a burden on your data collection structures that is often borne by staff members who must either randomly identify students in advance, or select the random sample from within a broader group of students. You should review who is being expected to do this work and the structures you have in place to support those efforts.
- Haphazard and Comprehensive sampling: A haphazard sample of student work such as what you get back when a subset of students respond to a survey, is less representative than a comprehensive sample of all the students of interest such as when every student at an institution or in a program is expected to submit a portfolio of their work as a degree requirement. However, in both cases you are not only increasing the amount of data that needs to be collected, but also creating an increased reliance on students to insure you obtain a reasonably representative or comprehensive sample. This does not necessarily reduce the reliance on staff, but it allows for potential increase in responsibility for the data to faculty and the students themselves. When evaluating the sustainability of such sampling plans it is critical to consider how the structures you have in place provide support for insuring maximum student data, whether it be through follow-up and incentives for student response or policies and requirements connected to programs of study that will be enforced by faculty and staff. For all kinds of sampling you should consider how your structures can both support your efforts to provide the amount of data that needs to be collected and support the relative roles for staff, students, and other stakeholders in insuring a representative sample (Table 1).
Table 1: Elements of Sampling Plans
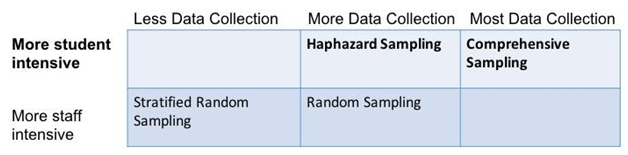
Different approaches to the times and contexts for collecting evidence
- Terminal vs. Longitudinal Assessment: Another important factor impacting the structural support required at your institution to sustain assessment efforts is the extent to which you assess students only at a terminal point in their program of study, or whether you also assess students at one or more additional points longitudinally across their program of study. Unlike terminal assessments, longitudinal assessments can help achieve the goal of providing information about ‘value added’ by the institution and/or student growth. However, they do so at a cost in terms of the pressures they place on your assessment structures.
- Embedded vs. non-embedded Assessment: Regardless of when they occur in a student’s academic career, assessments can either be embedded in existing courses, taking advantage of the existing course structure to insure the opportunity to collect this data, and relying at least in part on the faculty teaching those courses. On the other hand, if the assessments are conducted outside of the context of the classroom, you may rely on staff more heavily to insure the necessary data gets collected. Depending on the structures you have in place in the form of faculty or staff involved in collecting data, one or the other of these approaches may be more advantageous. However, one additional advantage of embedded assessment is that students may engage more meaningfully with the assessment instrument if they see it as an integral part of their program of study. As you evaluate the structures you have in place to sustain the assessment process, you should consider the relative number of data collection points and role for faculty and staff in your assessment efforts (Table 2).
Table 2: Elements of Timing and Context for Data Collection
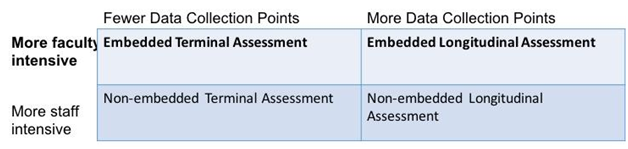
Download activity worksheet to capture data collection plan in a table.
3. Using Assessment Data: Taking inventory of what the data is telling us and what is being done with it
Having evaluated your data collection plans from the perspective of sustainability, it is also critical to evaluate the plans you have in place for using the data. The process for developing a data use plan is outlined in the Using Assessment Data module. This element of the Cycle of Inquiry can be viewed critically through the Structural Frame with an effort to determine if the organized structures we have in place, represented by our data use plan, will insure the necessary work gets done in an ongoing way from year to year. However, the data use plan is also an opportunity to revisit the stakeholders considered when you reviewed your goals and objectives through the political frame. Below is the table used in the Using Assessment Data module to help develop a data use plan. We can critically examine such a plan with an eye towards insuring sustainability.
| What are the goal/objectives you are trying to achieve? | What are the questions you are trying to answer? | Source of data/method of data collection | Benchmarks/Standards and Data Presentation | Audience/ Stakeholders | Potential uses of the data |
|---|---|---|---|---|---|
As you engage in the assessment process over time, it has been suggested in the Using Assessment Data module, that data use plans be converted to assessment reports documenting how the data has been shared and used. Such a report using the format below, includes the results of the assessment described and represented in terms of their relationship to the benchmarks and standards, details on the actual timing and audience for meetings to discuss the data, and the actual changes proposed and/or implemented in response to the data.
Download activity worksheet to capture data use plan.
| What are the goal/objectives you are trying to achieve? | What are the questions you are trying to answer? | Source of data/method of data collection | Comparison of Results to Benchmarks/Standards | Process of convening Audience/Stakeholders | Proposed and implemented changes |
|---|---|---|---|---|---|
These assessment reports can also be used to evaluate the sustainability of the assessment process, particularly from the perspective of determining whether you are actually using assessment data to impact changes at your institution. Evaluating the sustainability of your assessment processes requires exploring whether you have appropriate structures in place to support the review and use of data and appropriate processes to insure that you are ‘closing the loop’ in this manner.
A range of different structures and processes should be considered when examining these assessment practices:
1. Create structures to support the review and use of data: As you review the column of a data use plan or assessment report that addresses the audience and stakeholders, you should consider the structures you have in place for convening these stakeholders, sharing the data with them and fostering discussions about changes in response to the data. You should ask yourself who is doing the convening, organizing and sharing the data in advance of the meeting/event, and how are the organizers structuring the meeting/event to insure the participants ‘close the loop.’ Some of the potential groups and individuals whose roles should be considered in this manner are listed below:
- Curriculum committee
- assessment committee
- office of assessment
- institutional research and planning
- center for teaching and learning
- academic affairs/deans
- department chairs
- scholarly teaching and learning community
2. Examine processes that can provide accountability and documentation for the use of data: As you review the column of a data use plan or assessment report that addresses the potential uses of data or proposed or implemented changes based on data, it is important to consider what structures are in place at your institution or in your program to insure programs are accountable for and transparent about the ways in which they are using assessment data. In the absence of these processes, other institutional and program priorities can crowd out the time and effort needed for sustaining the assessment process. Some possible mechanisms for reporting out the results of assessment include:
- Annual Assessment Reports
- Program Reviews
- Accreditation reports
- Faculty promotion and tenure materials
- ‘Assessment Days’
- Public displays of data and actions through catalogs
- Public displays of data and actions through website
- Public displays of data and actions as part of student recruitment materials
3. Download activity worksheet to capture information needed in the Assessment Report.
4. Supporting Sustainability: Resources and support for the assessment process
Assessment Goals and Objectives may be viewed through both the political and symbolic frame, and data collection and data use may be viewed through these lenses as well, but particularly through the structural frame. Each of these elements of the cycle of inquiry has also been addressed in one of the other modules. However, arguably the most critical frame for a process that can be extremely intensive in terms of faculty and staff, is the human resources frame. Even further consideration of this will be provided in the next section. However, as you begin to think about sustainability of your assessment processes through the human resources frame, it is critical to consider both the professional development resources you are providing and the other forms of support for the faculty and staff engaged in the assessment process. Some simple examples include:
Professional Development Resources:
- Web-based resources
- Workshops
- Mentors
- Conferences
Support:
- Assessment mini-grants
- Assessment fellows
- Support personnel
- Technological support
Activity: Frame Analysis
In the warm-up activity for this section of the module, you looked at a few of the programs on your campus and began to consider what you could learn from them, or potentially contribute to them. For this activity, you should continue that exercise, but now looking at it through the lens of each of the four frames. Brainstorm what is happening at your campus, or if necessary reach out again to colleagues on your campus or others to learn more. Pick two or three assessment efforts that are underway with which you could see building a network to support your own assessment work. Restrict yourself to 2-3 besides your own to keep your plan manageable. Fill out the table below, and after briefly describing the assessment effort, complete the other columns with your evaluation of the strengths of each assessment effort (if any) from the perspective of each of the four frames.
| Program or Academic Area | Brief summary of relevant parts of assessment plan | Symbolic Frame Strengths | Political Frame Strengths | Structural Frame Strengths | Human Resources Frame Strengths |
|---|---|---|---|---|---|
Questions:
Now that you have examined a few different assessment efforts, consider what strengths in one area might also represent potential opportunities for your own assessment effort, either through some partnership or through learning from and building on the work in another area. Please provide a list of opportunities for your own assessment efforts through each of the different frames by responding to the questions provided below:
- Symbolic Frame Opportunities: How can you better connect your assessment efforts to the campus mission, strategic plan, international or national standards and/or accreditation?
- Political Frame Opportunities: How can you better connect your assessment efforts with critical stakeholders who have the potential to help insure its sustainability?
- Structural Frame Opportunities: How can you insure that you have the proper organizational and communication structures in place to sustain the level of assessment you have planned?
- Human Resources Frame Opportunities: How can you insure that you have provided appropriate support in the form of professional development resources, personnel, time and rewards to sustain your assessment process?
Download activity worksheet to record your answers.
Activity: Planning for Initiatives to Support Your Assessment Efforts
In the prior activity you identified strengths of a number of campus assessment efforts through each of the four frames and then considered opportunities to build on those strengths in the work of your own program. In the prior section of this module you also identified potential weaknesses of your own assessment efforts on campus, and common threats or obstacles to the sustainability of assessment practices. Now that you have also considered sustainability even further with a particular emphasis on the human resources frame, you should begin to have some ideas about how to approach sustaining assessment efforts in your own area. One common tool for this kind of planning is to complete a SWOT analysis, where the kinds of Strengths and Opportunities you have already identified can be combined with careful reflection on Weaknesses and Threats to your assessment efforts identified in the first part of this module.
For this activity, identify 1-3 different assessment initiatives you would like to build on and conduct a brief SWOT analysis for each using the table below. Download activity worksheet to record data in table presented below.
| Strengths | Weaknesses | Opportunities | Threats | |
|---|---|---|---|---|
| Initiative 1 Brief description | ||||
| Initiative 2 Brief description | ||||
| Initiative 3 Brief description |
Final Reflection
As you move into the next section of this module you will begin to consider how to plan for sustainable assessment. After completing the table in the preceding activity, take a moment to reflect on the following questions. You can do this exercise through either individual reflective writing or discussion with a partner.
- For the 1-3 initiatives you have identified what would be the first steps you would take to try to strengthen your assessment efforts?
- Do you feel that one or two of the frames in particular: symbolic, political, structural, or human resources, poses the greatest challenges at your institution in terms of sustaining assessment?
- What are the key questions you feel always need to be answered to determine if assessment practices are sustainable?
- For group dialogue: What is one piece of advice or information that you would give your colleague if they asked for feedback on how to improve and/or re-prioritize their efforts at supporting one or more of their initiatives?
Resources
Bolman, L. G., & Deal, T. E. (2013). Reframing organizations: Artistry, choice & leadership. 5th ed. San Francisco, CA: Jossey-Bass.
Maki, P. L. (2010). Assessing for learning: Building a sustainable commitment across the institution. 2nd ed. Sterling, VA: Stylus.
Wergin, J. F. (2002).ÂDepartments that work: Building and sustaining cultures of excellence in academic programs. San Francisco, CA: Jossey-Bass.
Chapter 3: How do you plan for sustainable assessment programs and practices at your institution?
Warm-Up Activity
Read the case study on one institution’s plan and process for assessing an undergraduate general education curriculum and then respond to the questions below:
- If this assessment process were taking place at your institution, how do you think you would be engaged in the process, given your current position?
- Which aspects of this assessment process struck you as beneficial? How do you think assessment supports the continued improvement of the PLAN curriculum?
- Did you see any potential for improvement in the type of data that is gathered? In how the data is shared or used?
- What is the one aspect of this assessment plan that might be most sustainable? The least sustainable?
- If you were an assessment consultant to this institution, what advice would you give them going forward?
In this module so far, you have been introduced to several frameworks for understanding and/or evaluating factors that can contribute to the sustainability of an assessment process. This section will introduce an additional lens for understanding and evaluating sustainability, derived from Peggy Maki’s Assessing for Learning.
In Assessing for Learning, Peggy Maki explains that sustainable assessment comes from embedding a cycle of inquiry into sustained institutional processes through the establishment of intentional connections with existing structures or processes (p. 283). The following three primary components contribute to this “maturation” of a sustainable assessment cycle:
1.) Establishing intentional connections with other campus processes, structures, systems, or rituals to create complementary relationships.
Examples include:
- Integrating the review of assessment data into a pre-existing annual departmental curriculum retreat
- Establishing permanent, active assessment committees
- Accounting for individual involvement in assessment activities in individual performance reviews and/or promotion and tenure processes
- Use in budget decisions and strategic planning
- Hiring personnel with assessment expertise
- Incorporating regular communication about assessment activities and findings at all institutional level.
2.) Committing resources that support assessment, such as professional time, funding, professional development, or investment in data-gathering or management software.
Examples include ‘start-up funds’ to:
- Hire an assessment expert
- Establish a website or in-house resource
- Establish funds or training to encourage innovative practices in assessment
- Establish peer mentoring program in assessment
- Support faculty to attend assessment conferences, meetings, and training
- Examples of resources to support ongoing assessment efforts could include:
- Course releases for a faculty member charged with ongoing departmental or program assessment
- Personnel support in assessment offices and centers for teaching and learning
- Initiation of large-scale institution or program-wide assessment projects
- Undertaking large curriculum revisions based on assessment data
- Software or other support for gathering and analyzing multi-year data
- Funding for externally-created assessment instruments or tools
- Expansion and permanence of the ‘start-up’ resources
3.) Regular campus practices that demonstrate intentional recognition for the value of assessment work in both institutional growth/health and the teaching and learning process.
Examples include:
- Annual assessment recognition awards
- Integrating assessment work into the faculty evaluation process
- Presentations of work to the Board of Trustees or at major campus meetings
- Orienting students to assessing for learning (and coaching them in self-monitoring around institutional learning objectives)
- Implementing regular self-reflection practices in all areas focused on continuous, data-driven improvement
- Faculty and staff development
- Incorporating introduction to assessment in orientation processes
- Regular assessment days or events
Activity: Analyzing the Sustainability of the Case Study
We have just reviewed the three primary components derived from Maki’s Assessing for Learning, with a variety of examples from each category. Let’s turn now to applying this framework to the analysis of the case study located above in the Warm-Up Activity.
For the exercise below, go back to the case study and look for examples of how each of the three primary components are evident (or not evident) in the case as indicators of the potential sustainability of the PLAN assessment process. For each of the three components, answer the questions about sustainability in the case study. Next, list your ideas for strengthening sustainability in each area.
A) Establishing intentional connections with other campus processes, structures, systems, or rituals to create complementary relationships.
How does the institution in the case study establish intentional connections?
Ideas for strengthening sustainability in this area:
B) Committing resources that support assessment, such as professional time, funding, professional development, or investment in data-gathering or management software
How does the institution in the case study commit resources to support assessment?
Ideas for strengthening sustainability in this area:
C) Regular campus practices that demonstrate intentional recognition for the value of assessment work in both institutional growth/health and the teaching and learning process.
How does the institution in the case study use regular campus practices that demonstrate the value of assessment?
Ideas for strengthening sustainability in this area:
The video shares the experiences of different faculty members and administrators in their efforts to create sustainable assessment practices or cycles of inquiry in each of their respective roles. Listen carefully to their experiences to help inform your work on the rest of this module.
Activity: Applying Principles for Sustainable Assessment
You have now reviewed several frameworks for describing criteria that contribute to sustainable assessment. In the space below, please list the top 5-10 guiding principles for sustainable assessment that you think will be most relevant or beneficial to you in your role.
| 5-10 Guiding Principles for Sustainable Assessment | |
|---|---|
| 1. | |
| 2. | |
| 3. | |
| 4. | |
| 5. | |
| 6. | |
| 7. | |
| 8. | |
| 9. | |
| 10. |
Next, let’s apply these principles, the frameworks presented throughout this module, and the examples of actions leading to assessment provided through the Maki framework. Select one of the three activities below, based on what best fits your current context.
Activity 1: Imagine that you are an assessment consultant who has been hired to recommend changes to improve the sustainability of current assessment practices at your institution. The institution is able to allocate $50,000 to improve the sustainability of assessment, and they are looking for your suggestions for how to best use the funds. You may make recommendations at either the institutional, school/college, or program level. You may want to refer back to data that you have gathered earlier in this module to inform your response. List your top 3-5 concrete recommendations below.
Activity 2: Imagine that you have been hired into a new role as the Director of Assessment (or given a new project, if you are already in that role) at your institution. One of your institution’s accrediting bodies (either at the institutional or program level) has provided critical feedback about assessment practices, noting that they are not sustainable, and that the current assessment plan is ineffective because assessment activity is functionally absent. You have been asked to lead a change initiative to address this program. Your task is to prepare a memo to the Provost for how you will provide leadership for the design and implementation of a new, sustainable assessment plan. You may want to refer back to data that you have gathered earlier in this module to inform your response. Write your memo below, including recommendations for the ‘first steps’ in the process.
Activity 3: Imagine that you are a full-time tenured faculty member, and your department chair has just left for a one-year sabbatical. The Dean has asked you to step in as interim chair during your colleague’s absence, and as part of your interim chair responsibilities, the Dean has asked you to develop a sustainable assessment plan for the department. The regular chair hasn’t put in the effort to do this work, and as the institution is up for its reaccreditation site visit in three years, the Dean sees your interim role as a timely opportunity to create a sustainable plan that won’t ’embarrass’ the department during the reaccreditation process. Write an email to the Dean, giving your top suggestions for how the two of you could best collaborate to create a plan that will be sustained when the current chair returns from leave.
Final Reflection
After completing the activities, answer the following questions. You can do this exercise through either individual reflective writing or discussion with a partner.
- Review your recommendations in the last activity. In what ways do they fit into or reflect the different frameworks for sustainability described in this module?
- What did you find most revealing about the current sustainability (or lack of sustainability) of assessment practices on your campus?
- How would your answers to the first activity be different if you had $200,000 to spend? If there was no funding available?
- What are the top 2-3 practices or changes that you think might have a positive impact on sustainability at your institution? How might those be enacted?
Resources:
Maki, P. L. (2010). Assessing for learning: Building a sustainable commitment across the institution (2nd ed). Sterling, VA: Stylus.
Conclusion and resources
Summary of Key Points
Sustainable Assessment Practices
- Sustainable assessment practices are collegial, collaborative, and inclusive, and build a culture of assessment that is both dynamic and adaptive — always driven by an institutional commitment to student learning.
- Some of the most common and pervasive hurdles to sustaining assessment are limited time, resources, understanding and expertise in assessment, as well as weak channels for communicating assessment processes, findings and outcomes that result in poor perceptions regarding the benefits of assessment.
- A pre-mortem, an analytic tool or exercise that considers in advance potential issues inherent in a process or a plan with the goal of preparing for them, can help you to identify the hurdles to your own assessment practices.
Evaluating Sustainability
- A campus or program’s assessment practices can be evaluated by examining them through four frames: Symbolic, Political, Structural and Human Resources.
- Evaluating assessment practices through the Symbolic frame involves asking what messages the campus sends in support of its assessment practices through connections with its mission, strategic plan, accreditation, and national and international standards, and the recognition provided for faculty and staff in their contributions to these efforts.
- Evaluating assessment practices through the Political frame involves asking who on the campus is involved in the assessment process and the resources they can bring to bear to support the effort, with the understanding that broad inclusion of faculty and staff as a community of inquiry is critical to support such an important process.
- Evaluating assessment practices through the Structural frame involves asking who on the campus is doing the work of identifying goals and objectives, gathering data, and using the data to affect change, in an effort to insure that the data gathering and data use plans can be sustained over the long term, and those involved have the autonomy necessary to sustain the assessment process.
- Evaluating assessment practices through the Human Resources frame involves putting in place professional development, resources, and support to insure that the faculty and staff engaged in the assessment process have the freedom, talent, skills, time and motivation, to complete the work, as well as clear evidence of the efficacy of their efforts so they will sustain them over time.
- By evaluating the strengths and weaknesses of your own assessment efforts as well as those of other programs on your campus or other campuses, you can anticipate potential threats to the sustainability of your assessment efforts and identify potential partnerships, efficiencies and promising practices, that offer opportunities for sustaining your assessment practices (A SWOT analysis).
Planning for Sustainability
According to Maki, a mature, sustainable assessment processes have three major characteristics.
- The first characteristic is the intentional connection between assessment and other campus processes, structures, systems, or rituals. These intentional connects create complementary relationships.
- The second characteristic is the ongoing commitment of resources to support assessment, including personnel, money, and professional development.
- The third characteristic is regular and intentional recognition for the value of assessment that is integrated into regular campus policies and practices. These include recognizing the value of assessment in the teaching and learning process as well as the strategic planning and growth process.
These three characteristics, and concrete examples of them in practice, provide ways that institutions can either measure the current sustainability of their assessment practices or develop a new, sustainable cycle of inquiry.
Reflection
Look back over your list of 5-10 guiding principles for sustainable assessment you generated for the last activity at the end of the module. Reviewing the content of the module as a whole, would you add anything to the list, remove anything? Can you articulate rationales for each guiding principle? If you could only do one thing in the next year to improve the sustainability of your assessment practices what would it be? How quickly could you implement it? What would you do next?
You may find it helpful to keep your final list of guiding principles and potential campus initiatives for sustainable assessment handy, and monitor your progress in bringing these principles to bear and promoting these initiatives.
Cited & Additional Resources:
Bolman, L. G., & Deal, T. E. (2013). Reframing organizations: Artistry, choice & leadership. (5th ed). San Francisco, CA: Jossey-Bass.
Maki, P. L. (2010). Assessing for learning: Building a sustainable commitment across the institution. (2nd ed.). Sterling, VA: Stylus.
Sanaghan, P. (2009). Collaborative Strategic Planning in Higher Education. Washington D.C.: NACUBO. National Association of College and University Business Officers.
Wergin, J. F. (2002). Departments that work: Building and sustaining cultures of excellence in academic programs. San Francisco, CA: Jossey-Bass. Retreived from: https://rpgroup.org The Research and Planning Group for California Community Colleges.